By: Michael Kramer
It’s not often that you get a clean sweep of bullishness across the board. Stocks, rates, the dollar, implied volatility, implied correlations, VVIX, and CDX high-yield credit spreads all traded higher on the day. Even CPI swaps finished higher. The only issue, of course, is that when all of these indicators rise simultaneously, it typically isn’t associated—in my experience—with rising stock prices; one would expect stocks to decline.
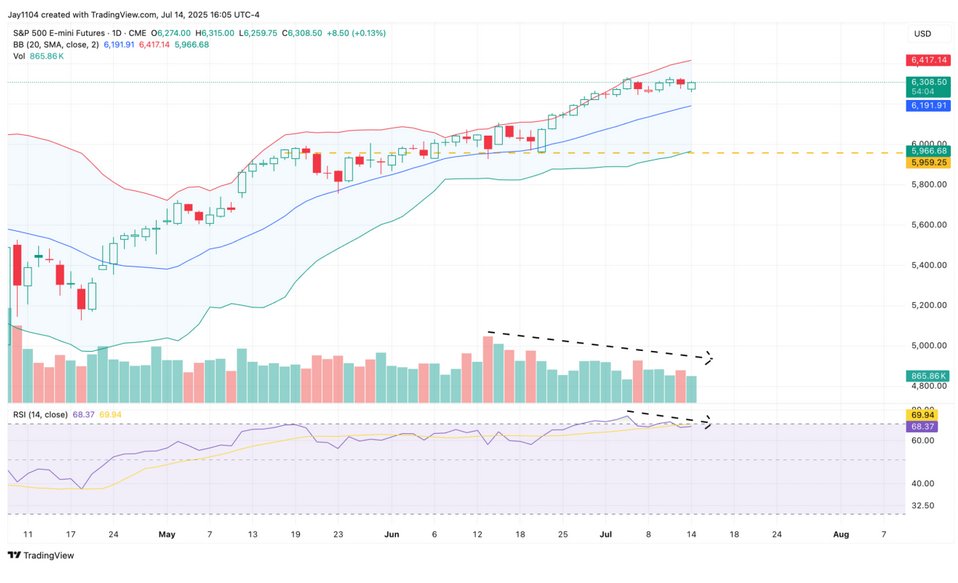
But this is what happens in a market where it took nearly the entire trading session for the S&P 500 e-mini futures to match the trading volume from 3 July—a half-day session.
As of 4:00 PM ET, only 864k contracts had traded, compared to 751k on 3 July. Declining volume, combined with an RSI that’s now slipping from overbought territory, suggests to me that buyers are running out of momentum to push this market higher. When volume eventually returns—as it always does—prices will likely see a correction.
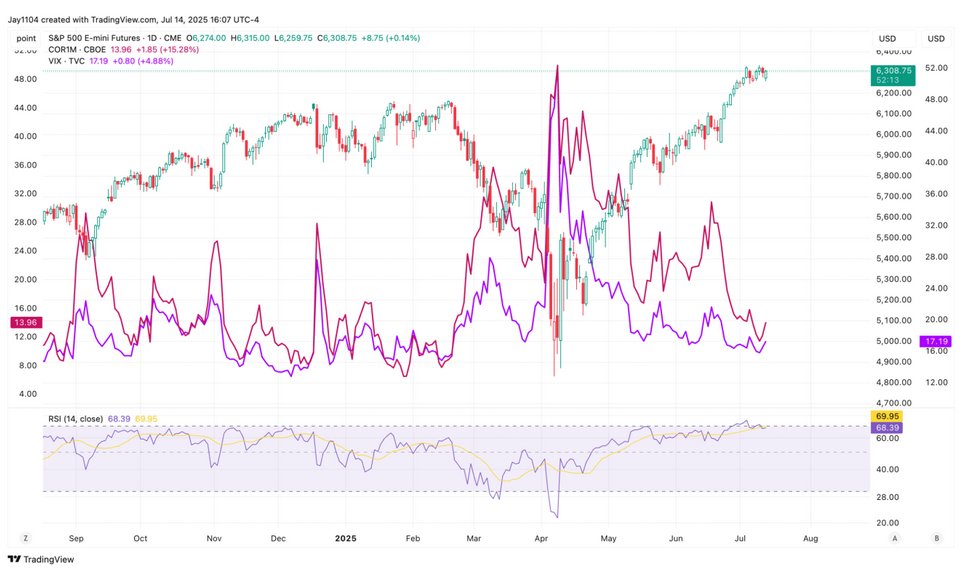
Typically, when implied volatility begins to rise—as it did today—alongside an increase in implied correlation, stocks tend to decline.
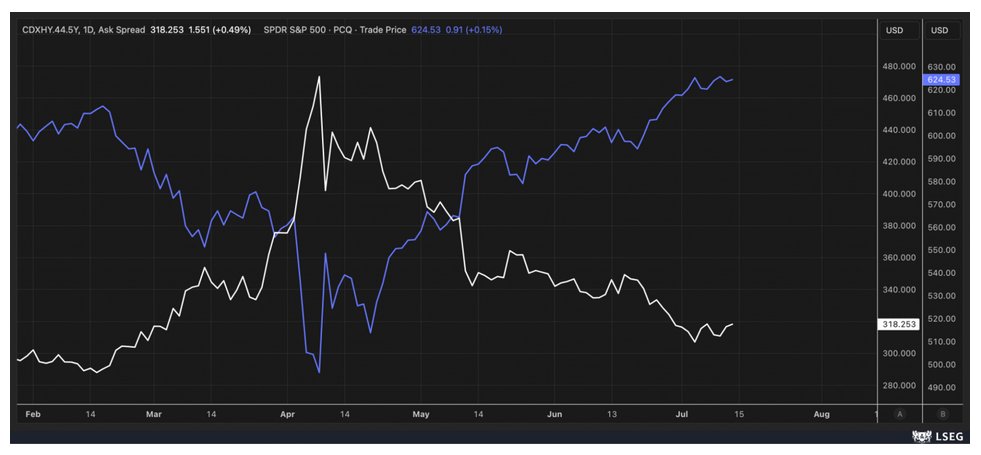
When CDX high-yield credit spreads start to widen—as they did today—stocks typically decline.
It’s an interesting dynamic: very low volumes in the futures market, combined with some unusual trading patterns across asset classes. It’s hard to say precisely, but I don’t think this current trend is likely to persist. Either stocks will need to start falling, or spreads, volatility, and implied correlations will need to begin declining.
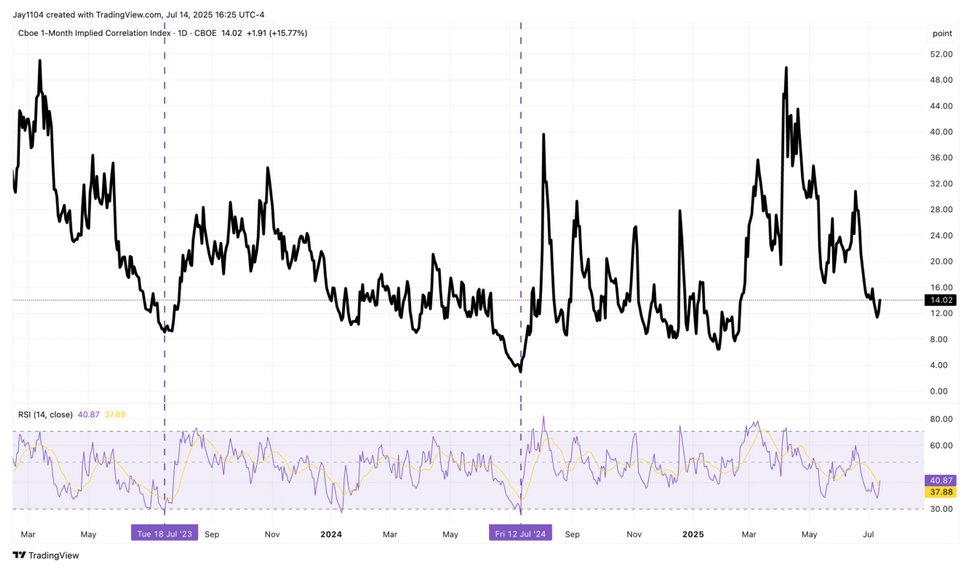
Seasonally, it makes sense not only for implied correlations to stop falling but also to start rising again as we move through earnings season. Given this backdrop, I find it difficult to believe that implied correlations will continue declining from here.
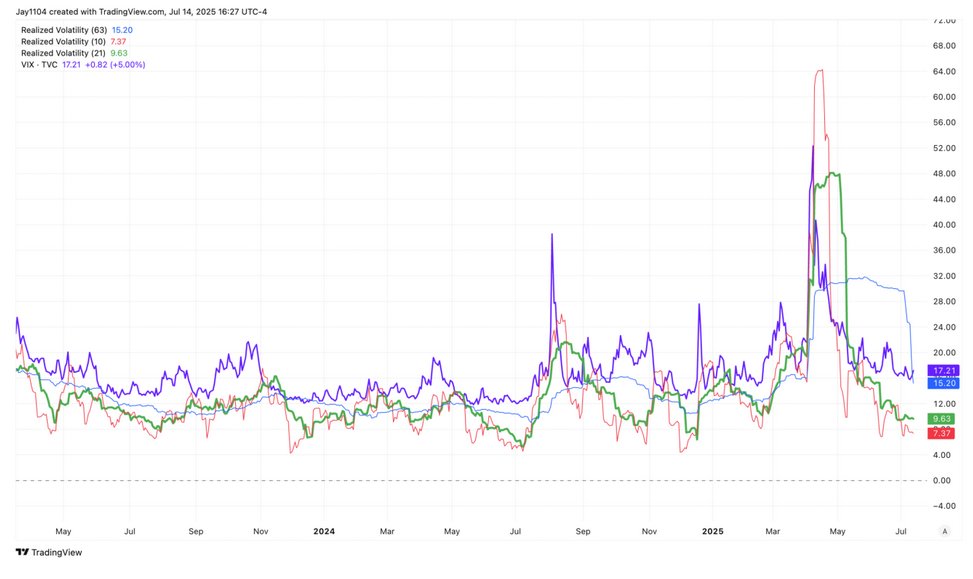
I also find it difficult to believe that the VIX has much further to fall, given that both 10-day and 21-day realized volatility appear to have bottomed out, and 3-month realized volatility probably isn’t far behind.
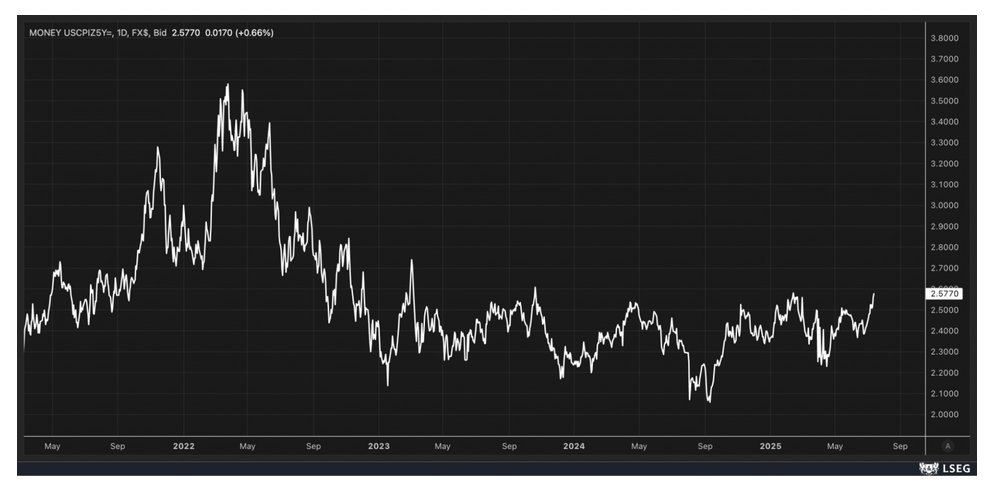
What is also clear is that the 5-year CPI swap is on the verge of breaking out from a trading range lasting more than two years. I think a move above 2.6% could be meaningful and noteworthy. Then again, we’ve seen it reach these levels before, only to pull back.
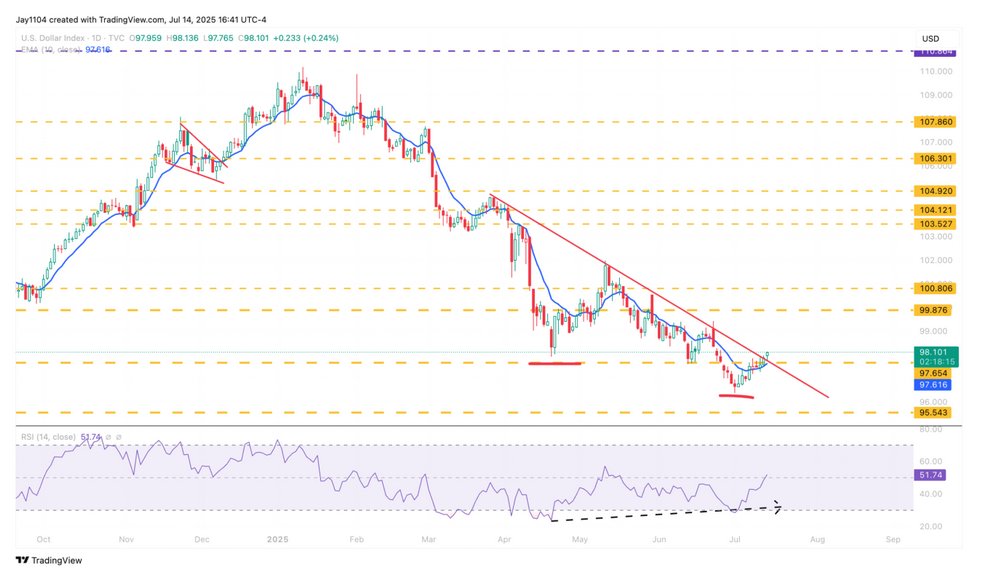
The dollar appears to have broken above its downtrend, and looks quite bullish at this stage.
Taiwan Semi (TSM) reports results on Thursday, and it will be interesting to see not only their earnings, but also their commentary regarding the impacts of tariffs and, more importantly, the recent weakening of the US dollar. A weaker US dollar has led to a strengthening Taiwan dollar, which could negatively impact TSM’s earnings since the company reports its results in Taiwan dollars.
This currency effect is already visible when comparing TSM’s local shares—which haven’t reached new highs—to its US-listed ADRs, which have. This difference primarily reflects the weaker US dollar.
Implied volatility for TSM isn’t excessively high—currently around 60% for the July 18 options expiration—but it might still be high enough that, following the earnings report, the delta on the $220 calls declines significantly. This decline could force the unwinding of hedges, potentially driving the shares lower.
Technically, TSM is currently sitting right on its trend line and the 10-day exponential moving average. Unless the stock can quickly surpass the July 3 high, it’s likely positioned for a pullback toward $205 or possibly lower.
Originally posted on July 14, 2025. For more charts, see Mott Capital blog
PHOTO CREDIT: https://www.shutterstock.com/g/BillionPhotos
VIA SHUTTERSTOCK
FOOTNOTES AND SOURCES:
Terms By ChatGPT
- CPI Swap: A financial derivative used by market participants to hedge or speculate on future inflation. It represents an exchange of a fixed rate (inflation expectation) for actual realized inflation.
- Implied Volatility (IV): A measure derived from the options market reflecting the market’s expectation of future volatility of an underlying asset. Higher implied volatility signals increased uncertainty or expected larger price movements.
- Call Delta: A sensitivity measure indicating how much an option’s price changes relative to a $1 change in the underlying stock. For instance, a delta of 0.5 means the call’s price changes by $0.50 for every $1 move in the underlying share.
- Hedge Unwind: The reversal or closure of hedging positions. For example, if investors previously bought shares to hedge their short call positions (positive delta hedging), they would sell these shares if the call’s delta declines, potentially pushing the underlying stock lower.
- Exponential Moving Average (EMA): A technical indicator used in charting to track the average price of a security, giving more weight to recent prices. The 10-day EMA specifically tracks the short-term trend and momentum.
- ADRs (American Depositary Receipts): Securities that represent shares in foreign companies traded on US exchanges, enabling investors to buy foreign stocks easily in US dollars.
- CDX High-Yield Credit Spreads: A financial index measuring the cost of insuring high-yield (riskier) corporate bonds against default. When spreads widen, it indicates increasing perceived risk in corporate credit markets.
- VVIX: The volatility index of the VIX, measuring the expected volatility of the VIX itself. Higher VVIX values suggest greater uncertainty or instability in volatility expectations.
- Implied Correlation: A market-derived measure indicating how closely investors expect stocks within an index (such as the S&P 500) to move together in the future. A rise in implied correlation often signals increased systemic risk or expected volatility.
DISCLOSURES
This report contains independent commentary to be used for informational and educational purposes only. Michael Kramer is a member and investment adviser representative with Mott Capital Management. Mr. Kramer is not affiliated with this company and does not serve on the board of any related company that issued this stock. All opinions and analyses presented by Michael Kramer in this analysis or market report are solely Michael Kramer’s views. Readers should not treat any opinion, viewpoint, or prediction expressed by Michael Kramer as a specific solicitation or recommendation to buy or sell a particular security or follow a particular strategy. Michael Kramer’s analyses are based upon information and independent research that he considers reliable, but neither Michael Kramer nor Mott Capital Management guarantees its completeness or accuracy, and it should not be relied upon as such. Michael Kramer is not under any obligation to update or correct any information presented in his analyses. Mr. Kramer’s statements, guidance, and opinions are subject to change without notice. Past performance is not indicative of future results. Neither Michael Kramer nor Mott Capital Management guarantees any specific outcome or profit. You should be aware of the real risk of loss in following any strategy or investment commentary presented in this analysis. Strategies or investments discussed may fluctuate in price or value. Investments or strategies mentioned in this analysis may not be suitable for you. This material does not consider your particular investment objectives, financial situation, or needs and is not intended as a recommendation appropriate for you. You must make an independent decision regarding investments or strategies in this analysis. Upon request, the advisor will provide a list of all recommendations made during the past twelve months. Before acting on information in this analysis, you should consider whether it is suitable for your circumstances and strongly consider seeking advice from your own financial or investment adviser to determine the suitability of any investment.