

By: Michael Kramer
A busy week is coming up with several significant market-moving events. Any one of these events individually could shake things up, but in this case, there’s at least one event every day.
On Monday, we get the first part of the quarterly refunding announcement, followed later in the day by the 2-year and 5-year Treasury auctions. Tuesday brings JOLTS data and a 7-year Treasury auction. Wednesday is packed, featuring the ADP employment report, second-quarter GDP data, the second half of the quarterly refunding announcement, and meetings of both the Bank of Japan and the FOMC. On Thursday, we’ll see the Employment Cost Index and the June PCE report. The week concludes on Friday with the release of the jobs report and ISM Manufacturing data. As if that weren’t enough, Amazon, Apple, Meta, and Microsoft are all reporting earnings this week as well.
Additionally, a largely forgotten court battle on tariffs will start on July 31, as the appeals court reviews the legality of the President’s tariffs.
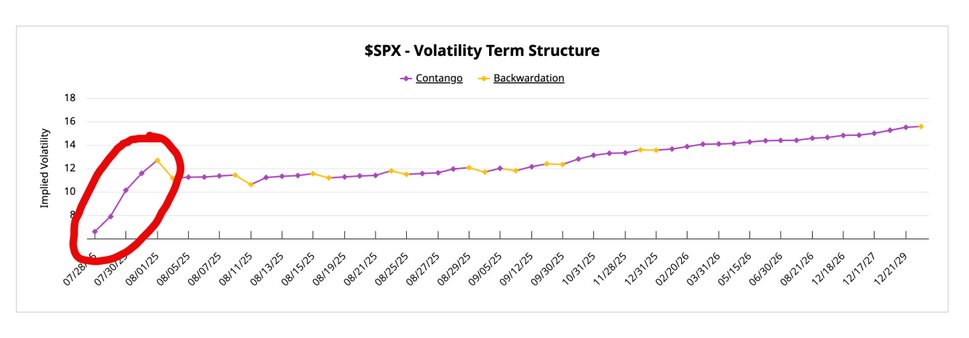
Yet, remarkably, the market doesn’t seem the least bit concerned about any of this. Implied volatility for Monday sits at a breezy 6.6%, rising to a supposedly “ground-shaking” 12.7% by Friday. This must be a joke, right? It has to be…
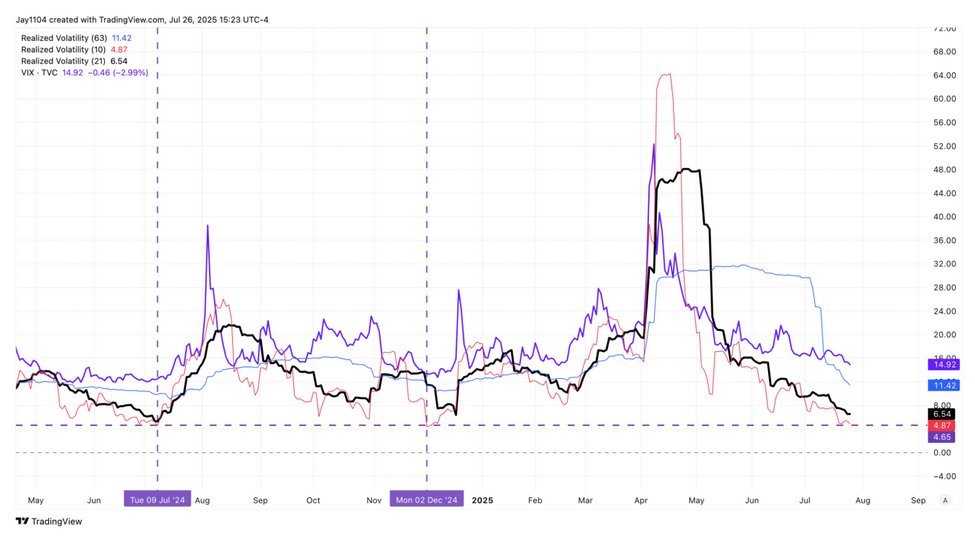
If the market continues trading in the tight ranges we’ve seen in recent weeks, even after all this news, I would be shocked. Something wouldn’t just be wrong—it would be completely broken. For 1-month realized volatility to fall further, we’d need daily trading ranges of less than 40 bps. To push 10-day realized volatility lower, the index would need to trade in ranges narrower than 30 bps per day.
I’ve noted repeatedly that the end of last week marked the window when implied correlation should begin to rise, potentially signaling some form of market top. So far, that hasn’t happened, but the window remains open through the end of this week—especially given the major earnings reports still due from META, MSFT, AAPL, and AMZN.
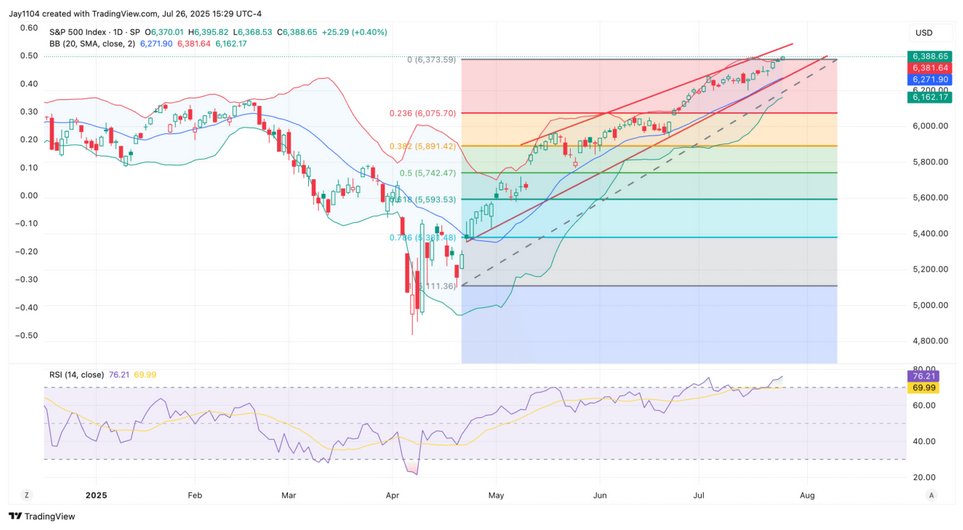
On top of that, the S&P 500 is now in overbought territory, with an RSI of 76, and is trading above its upper Bollinger Band.
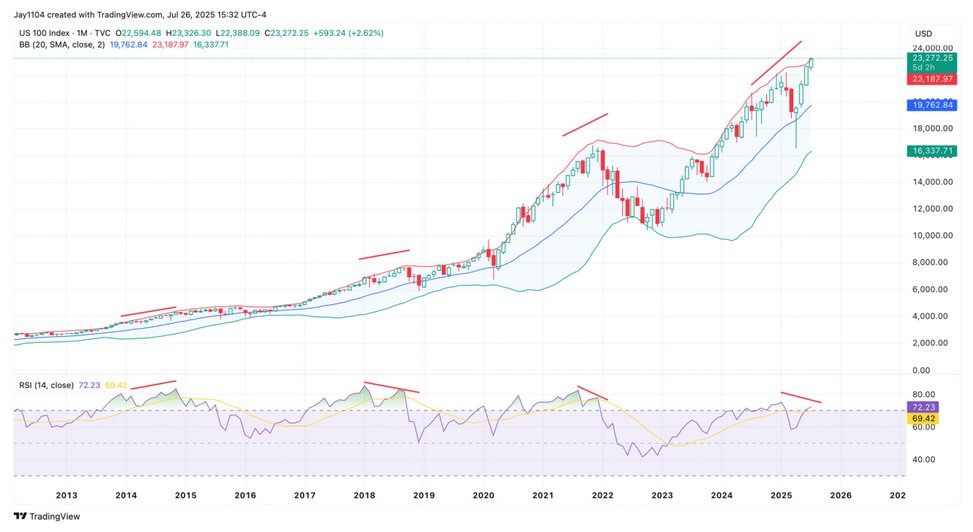
Not only that, but the NASDAQ 100 is also overbought on the monthly chart, with an RSI above 72 and trading above its upper Bollinger Band. Additionally, notice the price is rising while the RSI is forming a lower high—a divergence pattern similar to what occurred in 2018 and 2021.
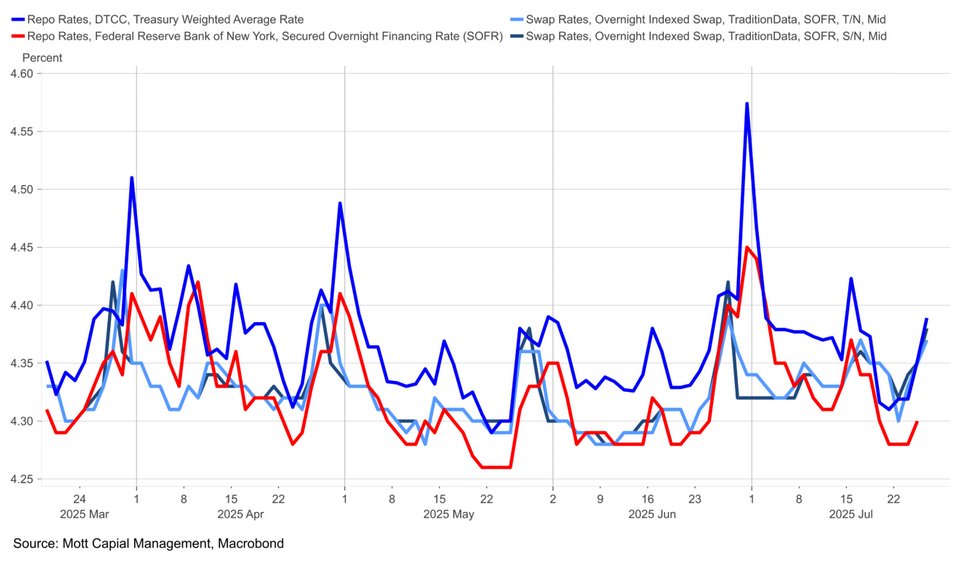
Additionally, as month-end approaches, liquidity typically becomes a concern—a problem compounded this week by significant Treasury settlements, which are likely to drive a more pronounced rise in the Treasury General Account (TGA). Overnight repo rates have already begun to increase, suggesting SOFR will move higher on Monday, and will need to be watched during the week.
Overall, a lot is going on this week, yet the market appears overly complacent. Given the sheer volume of news flow, I would be genuinely surprised if volatility remains this tight for much longer.
Originally posted on July 26, 2025 on Mott Capital Management blog
PHOTO CREDIT: https://www.shutterstock.com/g/LadadikArt
VIA SHUTTERSTOCK
FOOTNOTES AND SOURCES
Terms By ChatGPT
- Quarterly Refunding Announcement: An announcement by the U.S. Treasury detailing the government’s borrowing needs and upcoming debt issuance schedule.
- Treasury Auction: A government auction where securities like 2-year, 5-year, and 7-year Treasury notes are sold to investors, which can influence interest rates and market liquidity.
- JOLTS Data: The Job Openings and Labor Turnover Survey provides insights into job vacancies and hiring trends in the U.S. economy.
- ADP Employment Report: A private-sector employment report that estimates non-farm payroll employment changes.
- GDP (Gross Domestic Product): The total value of goods and services produced, measuring economic growth.
- FOMC (Federal Open Market Committee): The committee responsible for setting monetary policy in the U.S., particularly interest rate decisions.
- Employment Cost Index: A quarterly economic series detailing the growth of wages and benefits.
- PCE (Personal Consumption Expenditures): A measure of consumer spending widely tracked by the Federal Reserve for inflation indicators.
- Implied Volatility: Market-derived metric reflecting investors’ expectations of future price fluctuations.
- Realized Volatility: The actual historical volatility measured by past market movements.
- Implied Correlation: Market expectation of how stocks move in relation to one another; rising implied correlation often signals a topping market.
- RSI (Relative Strength Index): A momentum oscillator that measures speed and change of recent price movements to indicate overbought or oversold conditions.
- Bollinger Band: A volatility indicator using standard deviations to identify potential overbought or oversold market conditions.
- Treasury General Account (TGA): The U.S. government’s primary operational account at the Federal Reserve.
- SOFR (Secured Overnight Financing Rate): A benchmark interest rate based on overnight transactions in the U.S. Treasury repo market.
DISCLOSURES
This report contains independent commentary to be used for informational and educational purposes only. Michael Kramer is a member and investment adviser representative with Mott Capital Management. Mr. Kramer is not affiliated with this company and does not serve on the board of any related company that issued this stock. All opinions and analyses presented by Michael Kramer in this analysis or market report are solely Michael Kramer’s views. Readers should not treat any opinion, viewpoint, or prediction expressed by Michael Kramer as a specific solicitation or recommendation to buy or sell a particular security or follow a particular strategy. Michael Kramer’s analyses are based upon information and independent research that he considers reliable, but neither Michael Kramer nor Mott Capital Management guarantees its completeness or accuracy, and it should not be relied upon as such. Michael Kramer is not under any obligation to update or correct any information presented in his analyses. Mr. Kramer’s statements, guidance, and opinions are subject to change without notice. Past performance is not indicative of future results. Neither Michael Kramer nor Mott Capital Management guarantees any specific outcome or profit. You should be aware of the real risk of loss in following any strategy or investment commentary presented in this analysis. Strategies or investments discussed may fluctuate in price or value. Investments or strategies mentioned in this analysis may not be suitable for you. This material does not consider your particular investment objectives, financial situation, or needs and is not intended as a recommendation appropriate for you. You must make an independent decision regarding investments or strategies in this analysis. Upon request, the advisor will provide a list of all recommendations made during the past twelve months. Before acting on information in this analysis, you should consider whether it is suitable for your circumstances and strongly consider seeking advice from your own financial or investment adviser to determine the suitability of any investment.


