

By: Belle Chang, Senior Manager, Global Investment Research
Oil prices have long been one critical driver for macro and equity performance. Amid a volatile oil prices backdrop, we think it is crucial for investors to understand the correlation between oil prices and APAC equity markets.
- Among APAC equity markets, Australia has a higher beta to oil prices while India, Indonesia and Thailand have lower betas. Domestic political uncertainties have been one main reason for the decoupling trend seen in Indonesia and Thailand.
- Over the past three years, beta has dropped across most APAC markets. The fading correlation can be largely attributed to the explosive AI-led equity rally, which doesn’t necessarily have a strong correlation with strong economic growth and demand. Geopolitical and domestic political developments play an important role too. China is the only market that saw an increase in the beta to oil prices over the last three years.
- Breaking beta down by industry, industries with the highest positive betas to oil prices are predominantly in the Energy and Basic Materials industries. Consumer Staples, Consumer Discretionary and Utilities typically exhibit negative betas to oil prices. However, Australia Utilities stands out with consistently positive betas.
Oil prices have long been a key macro driver for global financial markets, and can have a stronger impact on particular equity markets. Recent geopolitical tensions had pushed Brent oil prices temporarily above $80/bbl, before the tension eased. Regardless of short-term developments, understanding the correlation between oil prices and APAC equity markets remains crucial. Some markets exhibit heightened sensitivity due to their reliance on energy imports or exports, while others may show inverse relationships due to industry composition or idiosyncratic macroeconomic backdrop. In this article, we look into the betas of APAC equity markets and industries to oil price changes, and the underlying reasons behind these dynamics.
Decoupling oil and equity trends
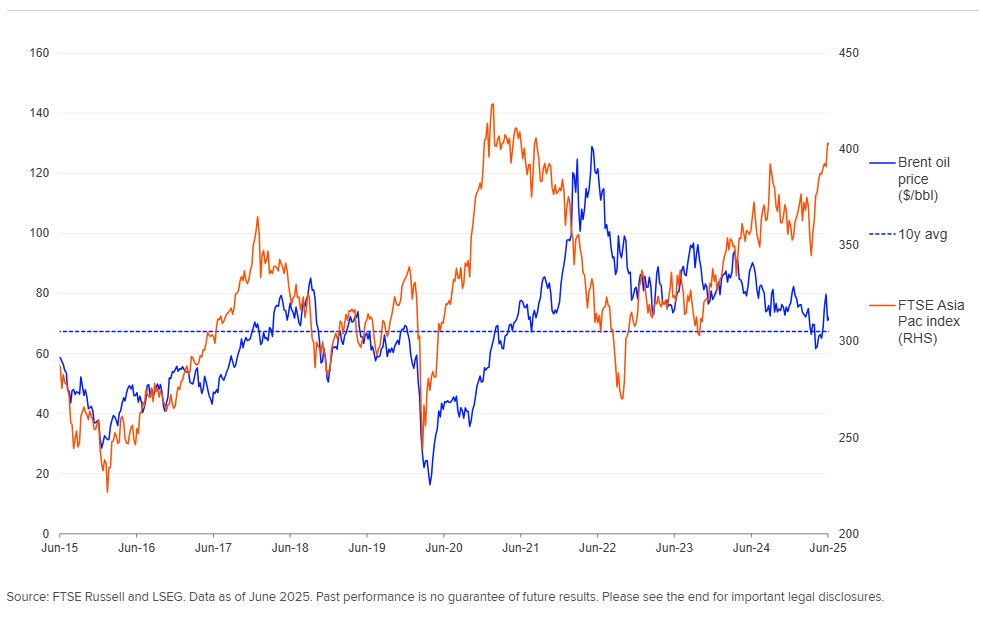
Traditionally, oil prices tended to move in the same direction as equities in the past. This is because in general, strong economic growth would usually mean stronger demand for oil and commodities, leading to higher oil prices, while equity markets tend to perform well amid economic upcycle. However, the relationship appears to have weakened since 2024 – a trend seen not only in the US but also in the APAC markets (Exhibit 1).
Over the last three months, oil prices have exhibited a rollercoaster move. From year start, oil prices continued to fall, driven partially by an expectation of slowing global economic growth, while in April, potential supply increase from OPEC+ and trade tariff uncertainties drove oil prices even lower. Since May, the de-escalation of tariffs uncertainty has sent oil prices higher again, while Middle East geopolitical shocks sent oil prices above $80 briefly.
EXHIBIT 1: BRENT OIL PRICES VS FTSE ASIA PAC
Beta to oil prices of APAC equity markets
Among APAC markets, Australia equity has the highest betas to oil prices (Exhibit 2). This is unsurprising as the Australian equity market has higher industry weights in Basic Materials (15.8% vs APAC 4.8% as of June 2025) and Energy (4.8% vs APAC 3.0%) compared with other APAC markets. More than half of Australia’s Energy stocks are in the Oil: Crude Producers sub-sector, while other markets, e.g. China and India, are more concentrated in the Oil Refining and Marketing and Coal sectors – which usually benefit from lower oil prices not higher.
EXHIBIT 2: 3Y ROLLING BETAS TO OIL PRICES – MAJOR APAC EQUITY MARKETS (WEEKLY OBSERVATIONS)
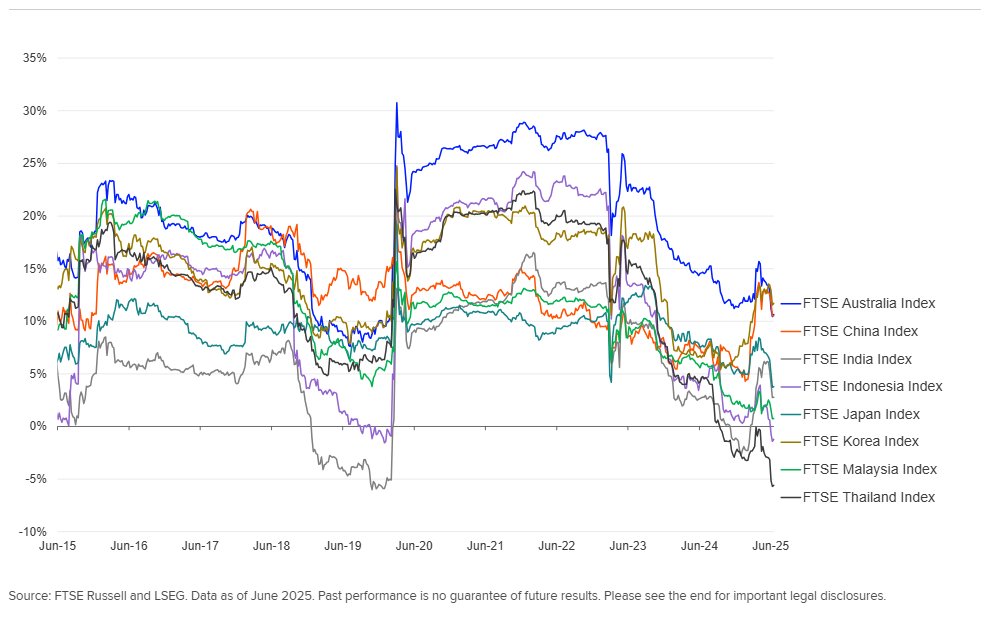
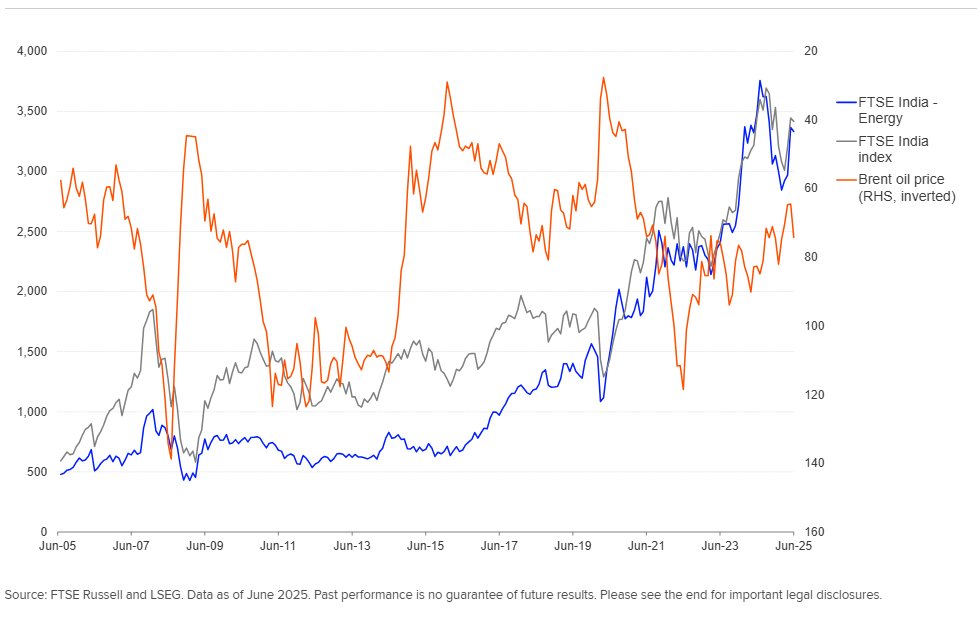
India has been one of the countries with lower betas to oil prices among APAC. One explanation is that the FTSE India index tends to be a beneficiary from lower oil prices (Exhibit 3) as the country is a big oil importer. In 2024, more than 30% of its imports were crude oil and oil related products. The Energy industry accounted for 9.8% of the FTSE India index – an important industry to the overall index performance. However, in India, Energy stocks (mainly Reliance Industries) focus more on oil-to-chemicals and new energy businesses, which benefits from lower but not higher oil prices. In addition, a lower oil price could help reduce Indian corporates’ costs, boosting the profitability of businesses. Moreover, the beta turned negative during the periods of 2019-2020 and from 4Q24 to 1Q25. During 4Q24 to 1Q25, India equity experienced a bear market which was driven by expensive valuation and foreign outflows but not by weaker fundamental outlook.
EXHIBIT 3: FTSE INDIA VS BRENT OIL (USD)
Indonesia and Thailand also have relatively low betas, with Thailand’s beta to oil prices dipping to negative territory in Q3 2024. Both countries have experienced domestic political turmoil. Hence, despite economic growth holding up fine and inflation being healthy, investor sentiment has been impacted in both Indonesia and Thailand. The two markets have underperformed APAC over the past two years.
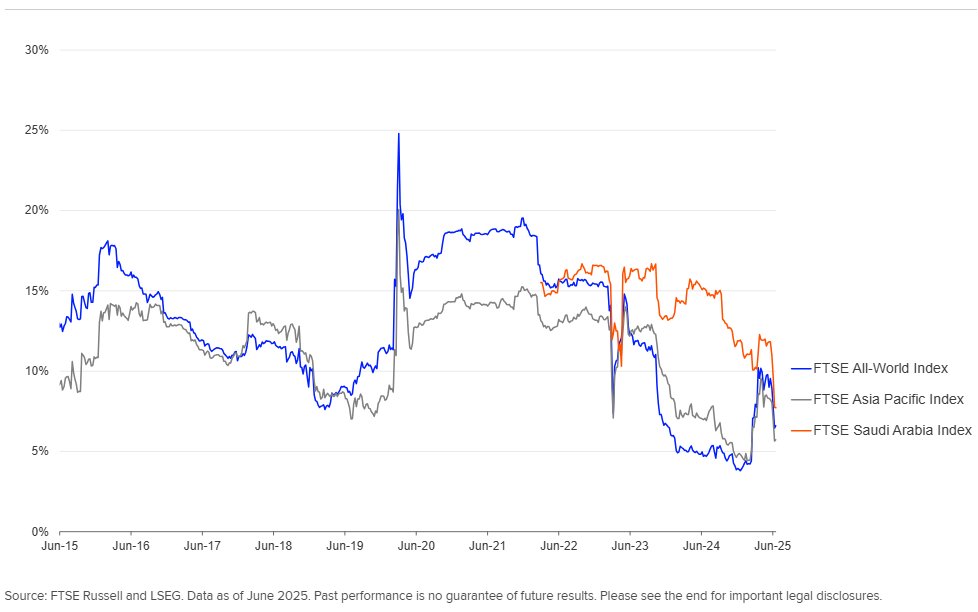
Most APAC markets’ current betas to oil are lower than three years ago
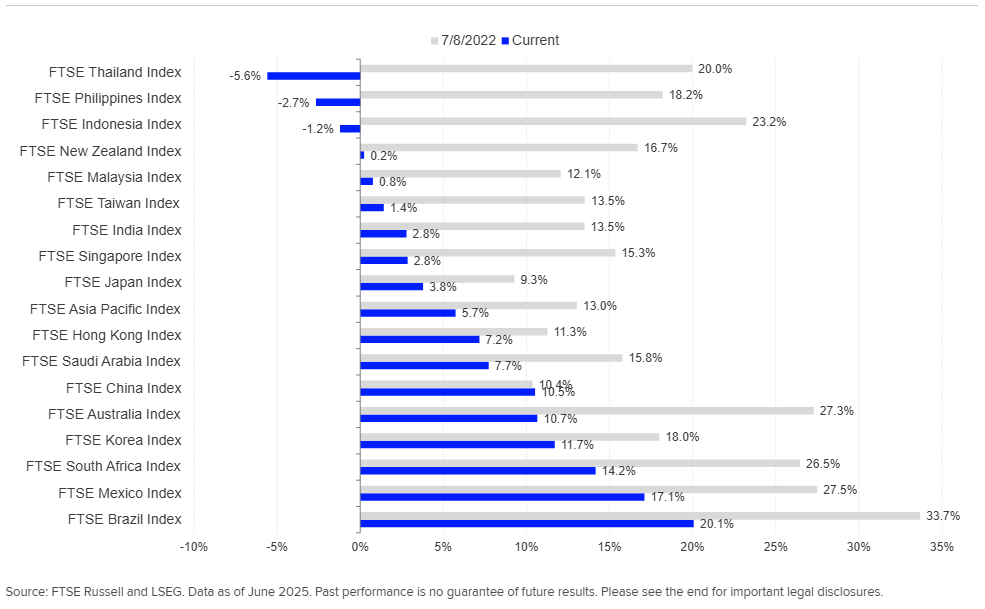
As Exhibit 4 and 5 show, beta has dropped across most APAC markets and other major EM markets over the last three years. The APAC equity market troughed in October 2022 while the explosive AI demand fueled further equity rally in 2023. On the contrary, oil prices peaked in June 2022 after the initial shock due to the Russia-Ukraine conflicts. Supply shocks have contributed to a decoupling between growth and oil prices, while the AI-led equity rally has further led to the disconnection of growth outlook and equity trends in many markets. Geopolitical and domestic political developments also contributed to the decoupling trends in markets such as Indonesia, Philippines and Thailand.
EXHIBIT 4: 3Y BETA TO BRENT OIL – 3 YEAR CHANGE
That said, China is the only market that saw an increase in the beta to oil prices over the last three years. After trending lower since early 2022, China’s beta began rising significantly from February 2025 onward. This shift coincided with the end of China’s prolonged bear market from 2022 to 2024, which was largely driven by domestic factors rather than external developments — resulting in a divergence between Chinese equities and global oil price trends. Additionally, the volatility of China’s equity market rose over the past year on the back of market fluctuations in response to various policy changes or stimulus. This has also contributed to its increasing beta.
EXHIBIT 5: 3Y ROLLING BETA WITH BRENT OIL
Industry Betas to oil prices
We also examine and compare industry-level betas across APAC equity markets. We exclude industries with only one constituent stock or less than three years of return history. This leaves us with a total of 113 industries in the analysis.
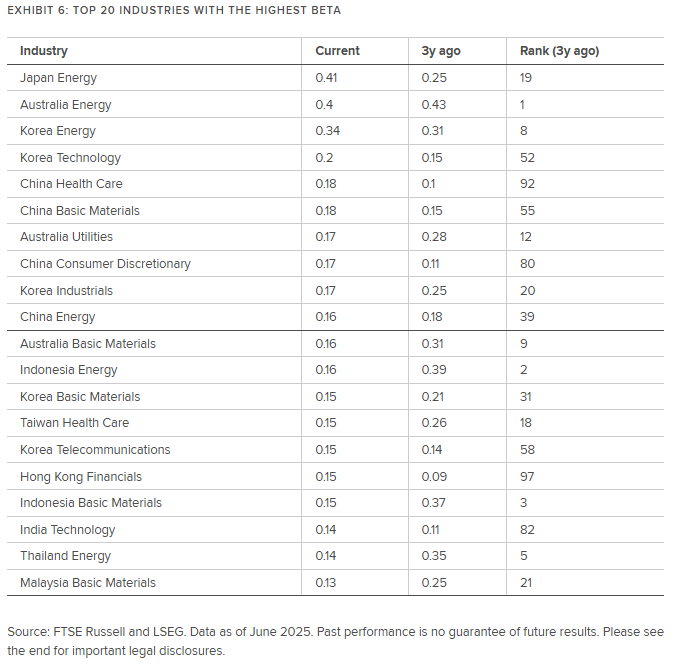
Unsurprisingly, industries with the highest positive betas to oil prices are predominantly in the Energy and Basic Materials industries. The top three industries with the highest 3y betas are Japan Energy, Australia Energy, and Korea Energy (Exhibit 6).
Utilities typically have a negative correlation with oil prices given the industry’s traditionally defensive nature. Utilities firms rely not only on oil but also natural gas and other alternative fuel sources, helping buffer them from direct oil price swings. Additionally, some Utilities firms have oil as an input, hence contributing to the negative relationship. However, Australia Utilities stands out with consistently higher betas – not only over the last three years but also over longer historical periods. This is largely because major Australia Utilities firms (e.g. AGL Energy and Origin Energy) are vertically integrated energy companies which are also involved in energy generation and upper stream businesses. This broader exposure to commodity markets and wholesale energy pricing makes them less defensive and more sensitive to market and oil price fluctuations compared to their regional peers.
EXHIBIT 6: TOP 20 INDUSTRIES WITH THE HIGHEST BETA
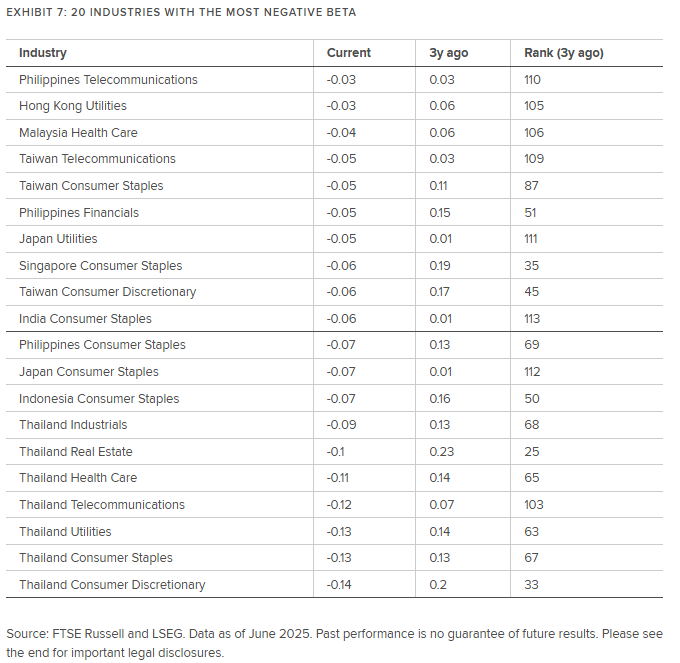
In contrast, Exhibit 7 shows that Consumer Staples stocks tend to have the most negative betas. Consumers’ spending on staples is less sensitive to economic cycle. In addition, higher oil prices reduce consumers’ disposable income, but staples are essential goods that are less directly impacted by lower spending power. As for Thailand, most industries exhibit negative betas, reflecting the impact of idiosyncratic domestic factors on the broader market, which has led to a more widespread decoupling from global oil price movements.
EXHIBIT 7: 20 INDUSTRIES WITH THE MOST NEGATIVE BETA
Conclusion
While traditional relationships between oil and equities have weakened, due to factors such as supply shocks, AI-driven rallies and geopolitical shifts, country- or industry-specific dynamics still play a critical role. Australian equities stand out with consistently high oil betas due to its commodity-heavy industry composition, while markets like India, Indonesia, and Thailand show lower sensitivity, mainly due to domestic geopolitical developments and industry compositions. At the industry level, Energy and Basic Materials exhibit the highest betas to oil prices, while Consumer Staples, Consumer Discretionary and Utilities tend to be less sensitive – with Australian Utilities being an exception given the industry’s vertical integration business strategies.
Originally posted on July 29, 2025 on LSEG blog
PHOTO CREDIT: https://www.shutterstock.com/g/kaedeezign
VIA SHUTTERSTOCK
DISCLOSURES
All information is provided for information purposes only. All information and data contained in this publication is obtained by LSEG, from sources believed by it to be accurate and reliable. Because of the possibility of human and mechanical inaccuracy as well as other factors, however, such information and data is provided “as is” without warranty of any kind. No member of LSEG nor their respective directors, officers, employees, partners or licensors make any claim, prediction, warranty or representation whatsoever, expressly or impliedly, either as to the accuracy, timeliness, completeness, merchantability of any information or LSEG Products, or of results to be obtained from the use of LSEG products, including but not limited to indices, rates, data and analytics, or the fitness or suitability of the LSEG products for any particular purpose to which they might be put. The user of the information assumes the entire risk of any use it may make or permit to be made of the information.
No responsibility or liability can be accepted by any member of LSEG nor their respective directors, officers, employees, partners or licensors for (a) any loss or damage in whole or in part caused by, resulting from, or relating to any inaccuracy (negligent or otherwise) or other circumstance involved in procuring, collecting, compiling, interpreting, analysing, editing, transcribing, transmitting, communicating or delivering any such information or data or from use of this document or links to this document or (b) any direct, indirect, special, consequential or incidental damages whatsoever, even if any member of LSEG is advised in advance of the possibility of such damages, resulting from the use of, or inability to use, such information.
No member of LSEG nor their respective directors, officers, employees, partners or licensors provide investment advice and nothing in this document should be taken as constituting financial or investment advice. No member of LSEG nor their respective directors, officers, employees, partners or licensors make any representation regarding the advisability of investing in any asset or whether such investment creates any legal or compliance risks for the investor. A decision to invest in any such asset should not be made in reliance on any information herein. Indices and rates cannot be invested in directly. Inclusion of an asset in an index or rate is not a recommendation to buy, sell or hold that asset nor confirmation that any particular investor may lawfully buy, sell or hold the asset or an index or rate containing the asset. The general information contained in this publication should not be acted upon without obtaining specific legal, tax, and investment advice from a licensed professional.
Past performance is no guarantee of future results. Charts and graphs are provided for illustrative purposes only. Index and/or rate returns shown may not represent the results of the actual trading of investable assets. Certain returns shown may reflect back-tested performance. All performance presented prior to the index or rate inception date is back-tested performance. Back-tested performance is not actual performance, but is hypothetical. The back-test calculations are based on the same methodology that was in effect when the index or rate was officially launched. However, back-tested data may reflect the application of the index or rate methodology with the benefit of hindsight, and the historic calculations of an index or rate may change from month to month based on revisions to the underlying economic data used in the calculation of the index or rate.
This document may contain forward-looking assessments. These are based upon a number of assumptions concerning future conditions that ultimately may prove to be inaccurate. Such forward-looking assessments are subject to risks and uncertainties and may be affected by various factors that may cause actual results to differ materially. No member of LSEG nor their licensors assume any duty to and do not undertake to update forward-looking assessments.
No part of this information may be reproduced, stored in a retrieval system or transmitted in any form or by any means, electronic, mechanical, photocopying, recording or otherwise, without prior written permission of the applicable member of LSEG. Use and distribution of LSEG data requires a licence from LSEG and/or its licensors.


