

(As volatility vanishes and Nvidia runs hot)
By: Michael Kramer
The upcoming week will be short but busy, packed with economic data and potential surprises. The JPM collar, expiring on Monday, initially seemed like a magnet pulling the market lower, but ultimately failed—though it might still have an impact.
Markets are strange animals: just when everything seems perfectly aligned for a particular outcome, they have a way of knocking you down, which is exactly what happened to me last week.
SOFR climbed to 4.4% by Friday morning and could move even higher by Wednesday. Meanwhile, the repo facility expanded to $285 billion and might increase further on Monday. Yet, despite liquidity draining from the market and rising overnight rates, it hasn’t mattered.
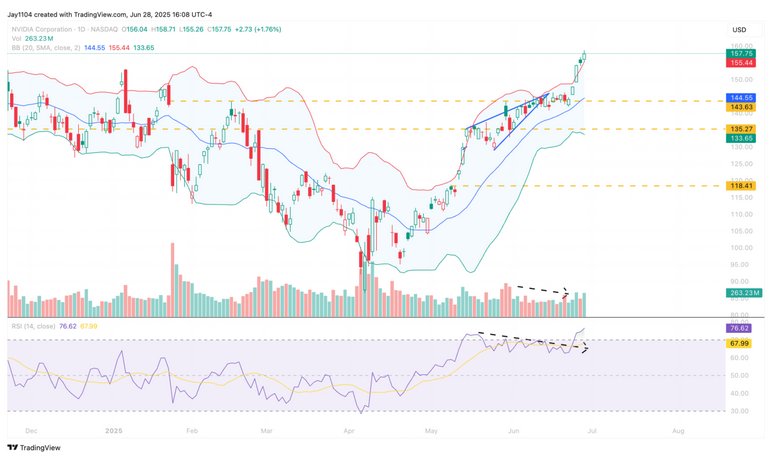
The strength of Nvidia’s rally overcame everything, perhaps due to the Russell rebalance, though I’m not sure. Regardless, Nvidia is now officially overbought, with an RSI above 76 and trading above its upper Bollinger Band for three consecutive days. At the very least, this suggests Nvidia may trade sideways, and at best, pull back toward its 20-day moving average. It isn’t easy to imagine it becoming even more overextended from here.
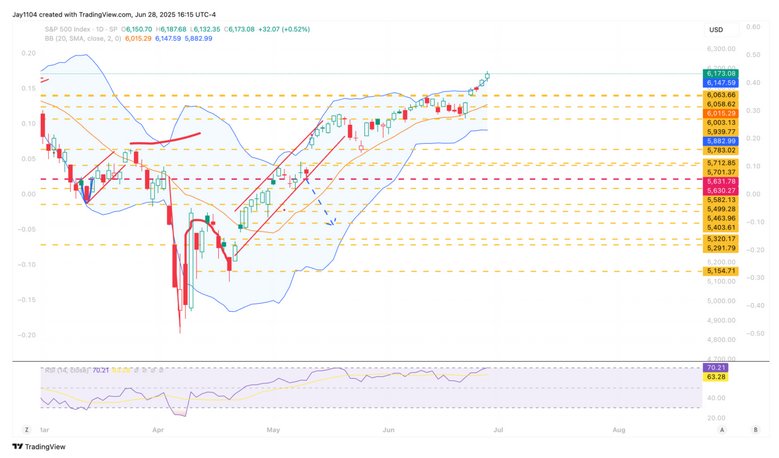
If Nvidia stops leading, things will become more complicated for the S&P 500. So, it’s no surprise that the S&P 500 itself is now overbought, with an RSI above 70 and two consecutive days trading above its upper Bollinger Band.
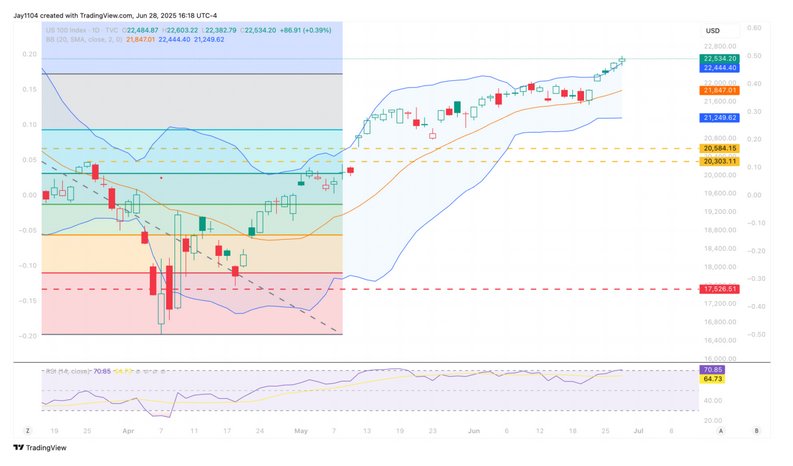
The NASDAQ has now traded above its upper Bollinger Band for four consecutive days and also has an RSI above 70, placing it firmly in overbought territory.
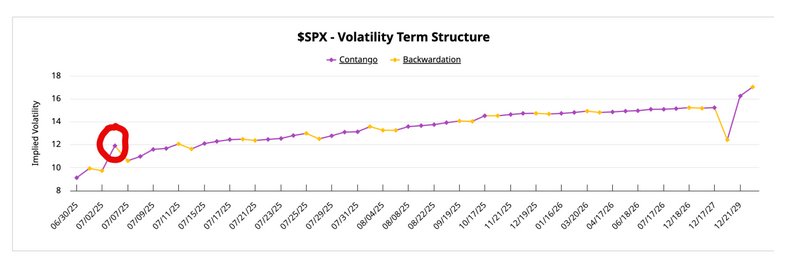
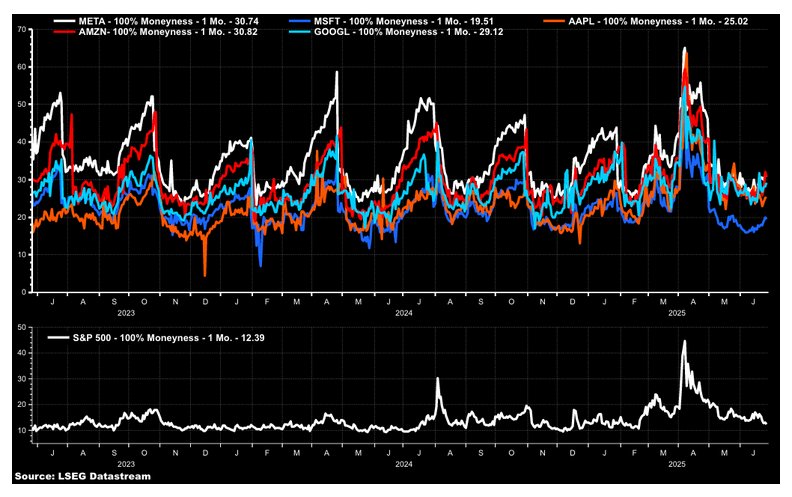
In some ways, it seems unbelievable to me that implied volatility is this low, given the heavy economic calendar next week, especially considering Friday’s White House commentary on Powell and trade. Monday’s IV stands at just 9.1%, and the only thing remotely normal in the term structure is the modest bump to 11.9% for July 3, coinciding with the jobs report. I’d be shocked if July 3 IV remains at 11.9% by the close on July 2; realistically, it should rise closer to 20%.
This reveals a lot about what’s currently driving the market higher—volatility suppression. Whether it’s from pure Vol Funds or volatility dispersion trades ahead of earnings season, both strategies have a limited lifespan. Typically, implied volatility (IV) for individual stocks begins rising a few weeks ahead of earnings and collapses after results are reported. The dispersion trade involves owning the IV of individual stocks while shorting the IV of the S&P 500. Currently, individual stock IVs are rising as expected, while SPX IV continues to decline. This dynamic likely explains much of the volatility suppression we’ve seen and why mega-cap stocks have surged.
However, this isn’t a typical quiet period devoid of news—quite the opposite. We’re set for a heavy flow of economic data this week. Additionally, I’m willing to bet that talk around trade deals will intensify, especially given that the S&P 500 hitting all-time highs likely emboldens President Trump. This scenario probably explains why we saw VVIX rise on Friday: volatility feels far too low, given these factors.
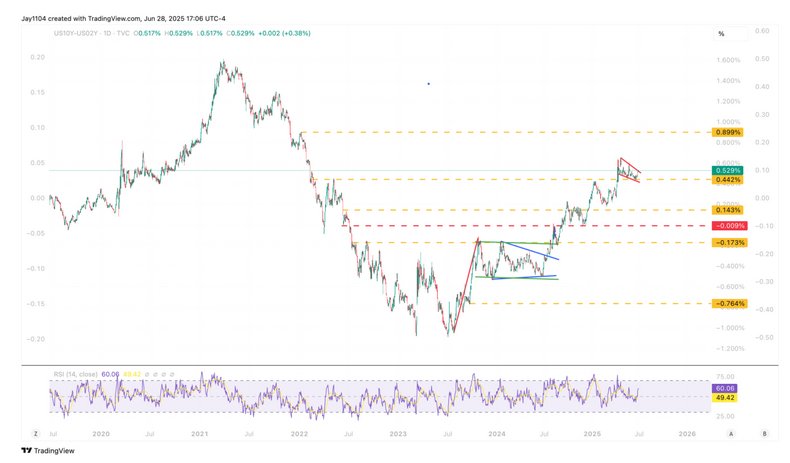
Additionally, the yield curve will likely come into sharp focus this week, given the data set to be released. The 2s/10s curve looks positioned for an upside breakout, and I believe we might finally see that move toward 90 bps I’ve been anticipating for several weeks.
Finally, gold broke through support on Friday and now faces the threat of a potential triple-top formation. To confirm this triple-top, gold would need to break below neckline support at $3,170. If that happens, it could fall back to roughly $2,890.
Silver has a potential diamond top that has formed, implying a return to $33.
Originally posted on June 30, 2025. See Mott Capital blog for more charts.
FOOTNOTES AND SOURCES
Terms by ChatGPT
- JPM Collar: A large, structured options trade by JPMorgan involving simultaneous buying of put options and selling of call options to manage equity market exposure.
- RSI (Relative Strength Index): A technical indicator measuring the speed and change of recent price movements to identify overbought or oversold conditions in a market.
- Bollinger Band: A volatility indicator consisting of a moving average plus and minus a standard deviation band, used to gauge whether prices are relatively high or low compared to recent volatility.
- SOFR (Secured Overnight Financing Rate): An interest rate that measures the cost of borrowing cash overnight, secured by Treasury securities, often seen as an indicator of short-term funding market liquidity.
- Reverse Repo Facility: A Federal Reserve operation allowing financial institutions to lend money to the Fed overnight, effectively withdrawing liquidity from the market.
- Implied Volatility (IV): A measure derived from options prices that indicates market expectations for future volatility of an underlying asset.
- Volatility Suppression: A situation where implied volatility is artificially low, often due to heavy selling of options or structured volatility trades.
- Volatility Dispersion Trade: An options trading strategy involving buying implied volatility in individual stocks (often ahead of earnings) while simultaneously selling implied volatility in a broader market index (like the S&P 500).
- VVIX: An indicator of the volatility of volatility itself, reflecting market expectations of how volatile implied volatility (IV) may be.
- Yield Curve (2s/10s): The spread (difference) between yields on 2-year and 10-year Treasury bonds, commonly used as an indicator of future economic expectations.
- Triple Top: A bearish technical pattern characterized by three peaks around a similar price level, signaling strong resistance and potential for a significant price decline if confirmed.
- Neckline (in technical analysis): The price level representing support beneath a chart formation (e.g., triple top or head and shoulders). Breaking below the neckline typically confirms the bearish pattern.
PHOTO CREDIT: https://www.shutterstock.com/g/TP71
VIA SHUTTERSTOCK
DISCLOSURES
This report contains independent commentary to be used for informational and educational purposes only. Michael Kramer is a member and investment adviser representative with Mott Capital Management. Mr. Kramer is not affiliated with this company and does not serve on the board of any related company that issued this stock. All opinions and analyses presented by Michael Kramer in this analysis or market report are solely Michael Kramer’s views. Readers should not treat any opinion, viewpoint, or prediction expressed by Michael Kramer as a specific solicitation or recommendation to buy or sell a particular security or follow a particular strategy. Michael Kramer’s analyses are based upon information and independent research that he considers reliable, but neither Michael Kramer nor Mott Capital Management guarantees its completeness or accuracy, and it should not be relied upon as such. Michael Kramer is not under any obligation to update or correct any information presented in his analyses. Mr. Kramer’s statements, guidance, and opinions are subject to change without notice. Past performance is not indicative of future results. Neither Michael Kramer nor Mott Capital Management guarantees any specific outcome or profit. You should be aware of the real risk of loss in following any strategy or investment commentary presented in this analysis. Strategies or investments discussed may fluctuate in price or value. Investments or strategies mentioned in this analysis may not be suitable for you. This material does not consider your particular investment objectives, financial situation, or needs and is not intended as a recommendation appropriate for you. You must make an independent decision regarding investments or strategies in this analysis. Upon request, the advisor will provide a list of all recommendations made during the past twelve months. Before acting on information in this analysis, you should consider whether it is suitable for your circumstances and strongly consider seeking advice from your own financial or investment adviser to determine the suitability of any investment.


