

By: Jose Torres, Senior Economist
A recent heightening of President Trump’s tariff declarations has market participants reaching for their risk-off playbooks ahead of the long Memorial Day weekend. The Commander in Chief woke up in a mood, exhibiting disappointment with the EU regarding trade negotiations and deciding to call for levies of 50% beginning on June 1. Similarly, the US head of state is frustrated with Apple Inc. and said he would add 25% duties if iPhones aren’t manufactured onshore. He was particularly upset with the company for making significant capital expenditures “all over India.” The increasingly confrontational developments related to cross-border commerce have pushed all major equity benchmarks and sectors into the red, as well as the greenback. But investors are boosting their exposures to Treasuries along the curve, commodities across the board, equity volatility protection instruments and forecast contracts.
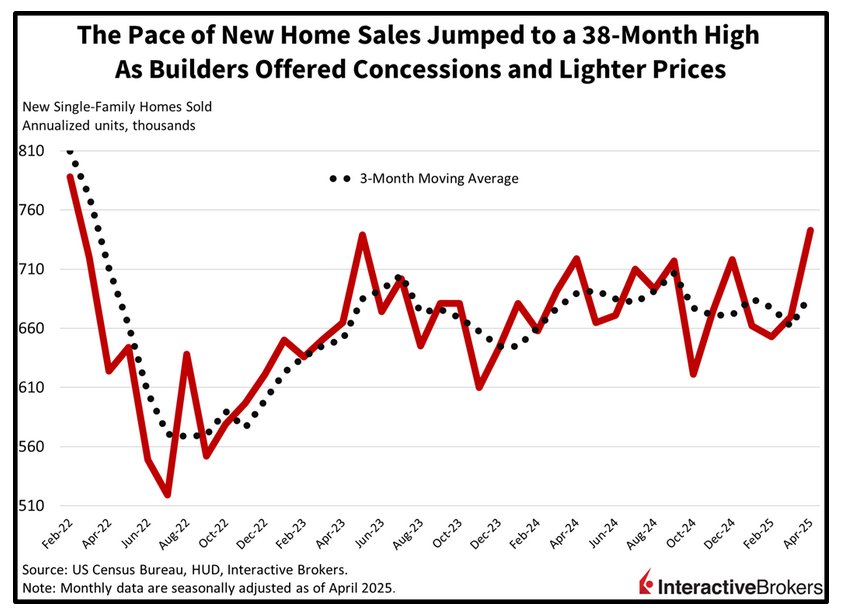
New Home Sales Soar to Highest in Over 3 Years
Today’s stateside economic calendar is uneventful for the most part with the exception of new home sales. We definitely experienced bifurcated performances last month, with the pace of transactions for existing properties declining while the rate for fresh builds jumped to its highest level in 38 months. The 743,000 seasonally adjusted annualized units sold in April marked a 10.9% month-over-month (m/m) increase, well above the median estimate of 692,000 and March’s 670,000. The Midwest, South and West drove the progress, sporting m/m increases of 35.5%, 11.7% and 3.3%. The Northeast retreated 14.8%, however. The strong showing was bolstered by builder concessions and discount offers to buyers.
Treasuries Rally from Here, But Equities Are a Question Mark
Where equities go from here in the short run depends heavily on how transatlantic negotiations fare. Completing a US-EU deal is pivotal as the euro zone comprises a heavy share of the global economy and engages in elevated trade volumes with Washington, helping to support corporate earnings and economic growth prospects. But the Treasury rout is overdone at this juncture folks. I think yields are posed to sink on the back of tame inflationary pressures and a more austere-than-expected GOP tax bill passing the House of Representatives. The outcomes of particular cross-border discussions, whether positive or negative, still push rates south, either because cost forces are soft or in light of slowdown worries ramping up due to punishing tariffs. Bonds rally under both conditions.
International Roundup
UK Households Boost Spending
UK shoppers didn’t shy away from stores in April with transactions climbing for the fourth-consecutive month. Retail sales adjusted for inflation were 1.2% stronger m/m, blowing past March’s 0.1% improvement and the estimate of 0.2%. Relative to one year ago, volumes were up 5%, outpacing economists’ call for 4.5% and the previously recorded 1.9%. Compared to March, food stores, department stores and household goods stores moved 3.9%, 2.8% and 2.1% more merchandise. The other non-food stores category and the textile clothing & footwear component experienced 3.1% and 1.8% contractions. Food stores reported that favorable weather caused households to loosen their purse strings.
But Consumer Confidence is Still Negative
The GfK Consumer Confidence Barometer remained in negative this month despite improving from -23 to -20 and surpassing the expected -22 result. The improvement is attributed to the UK reaching a trade deal with the US after broth countries had said they would implement heavy tariffs. Among subcomponents, the category of personal financial situations over the next 12 months climbed from -3 to 2 and the general economic situation over next 12 months went from -37 to -33. Neil Bellamy, Consumer Insights Director at GfK, believes that it’s encouraging to see the major purchase component lift from -19 to -16.
Retail Growth Continues in Canada
April retail activity increased by an estimated 0.5% m/m, a deceleration from 0.8% in March. On a positive note, expenditures were 5.6% above the year-ago comparable, exceeding the prior month’s 4.7%.
Singapore Prices Decline
The Singapore CPI retreated 0.3% m/m in April after sinking 0.1% in March. Conversely, costs rose 0.9% versus a year ago, surpassing the 0.8% forecast but matching the increase associated with the previous month. The core version, meanwhile, posted a 0.7% y/y gain compared to anticipation for the number to match March’s 0.5% score. Within the headline m/m metric, the housing & utilities group led the decline, falling 2.1% with the accommodation subcomponent down 2.6%. Additionally, shoppers paid 0.6% less for the clothing & footwear category.
Japan’s Inflation Exceeds Estimate
Japan’s core Consumer Price Index (CPI) accelerated to 3.5% y/y in April, higher than the consensus prediction of 3.4% and March’s 3.2% print. The recent result depicted the highest cost pressures in over two years. The benchmark excludes volatile fresh food, a classification that has provided some relief at the cash register following an 18% y/y jump in the preceding reporting interval. The broad headline CPI benefited due to this change, which offset the impact of more expensive energy driven by the government terminating subsidies. Stickers also rose for other types of groceries, including rice, but the broader CPI’s northward movement of 0.4% m/m was up from 0.3% in the prior period, but on a y/y basis, its 3.6% hike matched March’s pace.
Originally posted on May 27, 2025 on Traders’ Insight
PHOTO CREDIT: https://www.shutterstock.com/g/Sunil+prajapati
VIA SHUTTERSTOCK
DISCLOSURE
Information posted on IBKR Campus that is provided by third-parties does NOT constitute a recommendation that you should contract for the services of that third party. Third-party participants who contribute to IBKR Campus are independent of Interactive Brokers and Interactive Brokers does not make any representations or warranties concerning the services offered, their past or future performance, or the accuracy of the information provided by the third party. Past performance is no guarantee of future results.
This material is from IBKR Macroeconomics, an affiliate of Interactive Brokers LLC, and is being posted with its permission. The views expressed in this material are solely those of the author and/or IBKR Macroeconomics and Interactive Brokers is not endorsing or recommending any investment or trading discussed in the material. This material is not and should not be construed as an offer to buy or sell any security. It should not be construed as research or investment advice or a recommendation to buy, sell or hold any security or commodity. This material does not and is not intended to take into account the particular financial conditions, investment objectives or requirements of individual customers. Before acting on this material, you should consider whether it is suitable for your particular circumstances and, as necessary, seek professional advice.


