

By: Michael Kramer
The primary focus this coming week will remain on the bond market, with the Treasury auctions drawing significant attention. On Tuesday, the Treasury will auction a 2-year note, followed by a 5-year note on Wednesday and a 7-year note on Thursday.
These auctions should fare better than last week’s poorly received 20-year auction. Still, they take place midday and could have a substantial market impact, especially if they go poorly.
The most recent steepening in the yield curve has come from the back end, as the 10-year and 30-year yields have risen sharply. Both fundamental and technical indicators suggest these rates could climb even higher. You can watch this week’s YouTube video for more information.
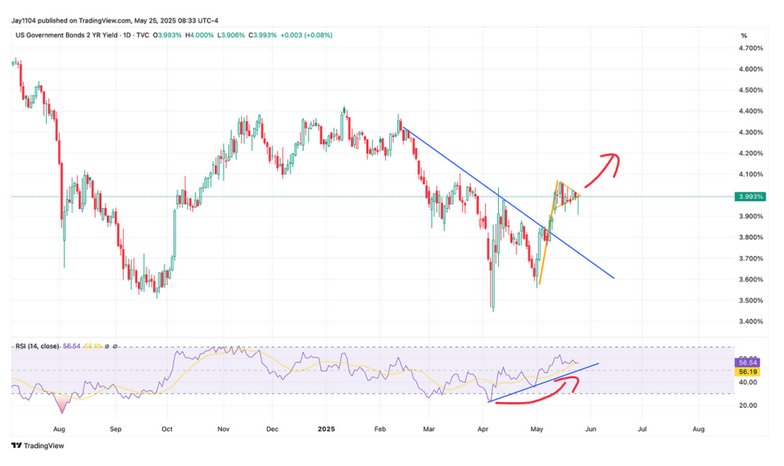
However, short-end rates may also rise in the near term based on technical signals. The RSI on the 2-year yield is trending higher and has turned an important corner, suggesting bullish momentum. Additionally, the 2-year downtrend has broken to the upside and is now consolidating inside a wedge, which could be forming a bull pennant. A breakout above 4% could send the 2-year yield toward 4.25%.
Meanwhile, the 10-year has already broken free of the bull flag, risen about 50% of its projected value, and is likely still heading to around 4.85%.
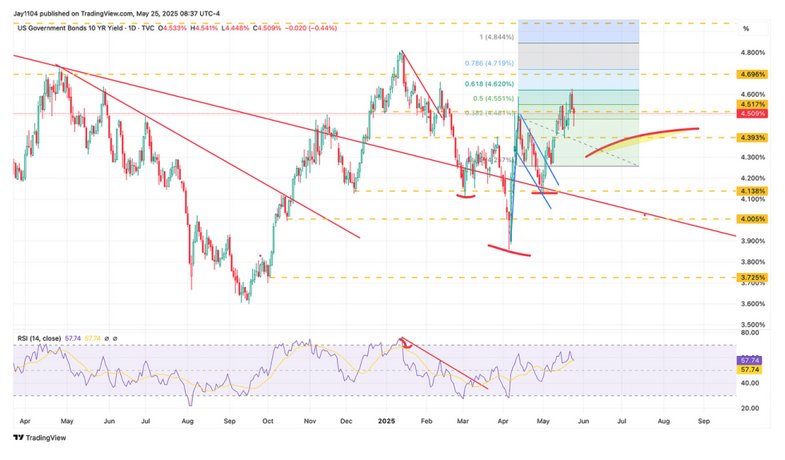
This would suggest that the yield curve will steepen further, with the 10-year rate probably rising slightly faster than the 2-year. I think the spread could widen to about 80 bps.
Meanwhile, the S&P 500 appears to have completed a rising wedge pattern. It has now closed below the 10-day exponential moving average for a third consecutive day, while finding support at the 200-day moving average. If this is indeed a rising wedge, a typical retracement would suggest a move to at least 5,260, representing a 61.8% retracement of the recent advance.
The strongest confirmation of this pattern would come if the index gaps below the 200-day moving average when trading resumes on Tuesday, which would also create an island reversal top. However, if the index advances beyond 6,000, it would invalidate the setup.

However, I think there’s a good chance the decline will play out, as we’re seeing the USDJPY move lower. It has fallen below a trendline previously broken above, effectively invalidating the bullish breakout. This suggests the USDJPY is likely to strengthen back toward 140.
Additionally, dollar funding cost are starting to increase for the Yen and Euro, and that is typically a bearish indicator for the S&P 500 as well.
On Friday, the SMH ETF gapped below its 200-day moving average, which acted as resistance for the remainder of the day. Additionally, it appears that SMH has formed an island reversal top.
Nvidia reports results this week, and it will be interesting to see if they stick to the usual playbook—beating estimates by $2 billion and raising guidance by another $2 billion above the beat. This quarter, however, may be different, given the headwinds from export controls they’ve previously flagged.
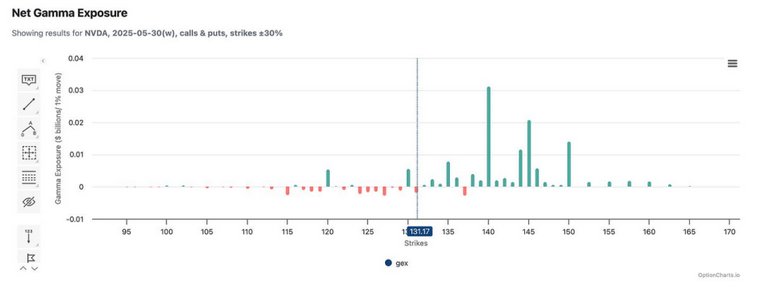
A large amount of gamma is concentrated at the $140 level, which is likely to act as resistance. Nvidia will need to break through that level following earnings—otherwise, the stock could be in trouble.
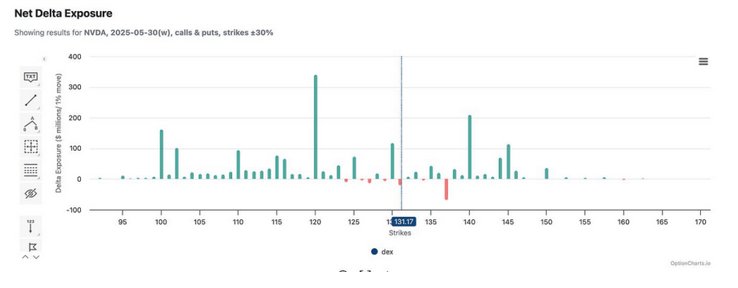
Delta values are very positive, which means that as implied volatility (IV) rises heading into earnings, it’s more likely to crash afterward. This increases the chances of post-earnings selling pressure, as call premiums decay and traders unwind bullish positions.
IV is currently around 77.5% and could exceed 100% when Nvidia reports. That’s making both calls and puts increasingly expensive. For example, a $131 call expiring Friday is currently priced at $5.30, meaning the stock needs to rise above $136.30 to break even. If IV jumps to 120%, that call could cost around $7.65, pushing the breakeven closer to $138.65. While that move isn’t impossible, the rising cost of options raises the bar for profitability.
Once results are released and IV drops to, say, 60%, the value of those calls could fall to around $3.89. That’s a significant decline, meaning many previously profitable calls may no longer be in the money and could start getting sold. So, unless the results are strong enough to push the stock above $140, the narrative will quickly become: “The results just weren’t good enough.”
Technically, a drop below $130 would set up a move back toward $115.
Originally posted on May 27, 2025. For more data charts, see Mott Capital blog
PHOTO CREDIT: https://www.shutterstock.com/g/hjalmeida
VIA SHUTTERSTOCK
FOOTNOTES AND SOURCES:
Terms By ChatGPT
1. Gamma
- Definition: A measure of how much the delta of an option changes as the underlying stock price changes.
- Why it matters: High gamma means the option’s price will move more dramatically as the stock moves, leading to potential feedback loops in stock price action, especially around key strike prices.
2. Delta
- Definition: The sensitivity of an option’s price to a $1 change in the underlying stock. For example, a delta of 0.50 means the option will gain or lose $0.50 for every $1 move in the stock.
- Why it matters: High delta means the option behaves more like the stock itself. Positive delta in calls suggests bullish positioning.
3. Implied Volatility (IV)
- Definition: The market’s forecast of how much the stock is expected to move, expressed as a percentage.
- Why it matters: Higher IV makes options more expensive. After earnings, IV often collapses, causing options to lose value—this is known as a vol crush.
4. Breakeven Price
- Definition: The stock price at which buying an option results in neither a profit nor a loss. It’s calculated as:
- Call Option: Strike Price + Premium Paid
- Put Option: Strike Price – Premium Paid
5. Island Reversal Top
- Definition: A chart pattern where prices gap up, consolidate, then gap down, leaving a “stranded” set of candles on the chart. It’s considered a bearish reversal signal.
6. Rising Wedge
- Definition: A technical chart pattern where price moves higher but within converging trendlines. It often signals a bearish reversal.
7. Bull Pennant
- Definition: A short-term continuation pattern that follows a strong upward move (flagpole), followed by a brief consolidation phase (pennant). A breakout usually leads to further upside.
DISCLOSURES
This report contains independent commentary to be used for informational and educational purposes only. Michael Kramer is a member and investment adviser representative with Mott Capital Management. Mr. Kramer is not affiliated with this company and does not serve on the board of any related company that issued this stock. All opinions and analyses presented by Michael Kramer in this analysis or market report are solely Michael Kramer’s views. Readers should not treat any opinion, viewpoint, or prediction expressed by Michael Kramer as a specific solicitation or recommendation to buy or sell a particular security or follow a particular strategy. Michael Kramer’s analyses are based upon information and independent research that he considers reliable, but neither Michael Kramer nor Mott Capital Management guarantees its completeness or accuracy, and it should not be relied upon as such. Michael Kramer is not under any obligation to update or correct any information presented in his analyses. Mr. Kramer’s statements, guidance, and opinions are subject to change without notice. Past performance is not indicative of future results. Neither Michael Kramer nor Mott Capital Management guarantees any specific outcome or profit. You should be aware of the real risk of loss in following any strategy or investment commentary presented in this analysis. Strategies or investments discussed may fluctuate in price or value. Investments or strategies mentioned in this analysis may not be suitable for you. This material does not consider your particular investment objectives, financial situation, or needs and is not intended as a recommendation appropriate for you. You must make an independent decision regarding investments or strategies in this analysis. Upon request, the advisor will provide a list of all recommendations made during the past twelve months. Before acting on information in this analysis, you should consider whether it is suitable for your circumstances and strongly consider seeking advice from your own financial or investment adviser to determine the suitability of any investment.


