

By: Steve Sosnick, Chief Strategist at Interactive Brokers
Markets often become enamored with buzzwords, and the current favorite is “capitulation.” It is a frequent topic in financial media – I was asked about it last Thursday – and a highly relevant one. Capitulation occurs when investors seem to despair that stocks will never go up again. Understandably, that is an elusive concept to measure –and we’ll discuss some of the ways to discern it – but if everyone is looking for capitulation, it is less likely to arrive.
Here’s the paradox – if everyone is looking for capitulation it is another way of trying to figure out when the market has bottomed. So if everyone is actively looking for a market bottom, it means that they haven’t thrown in the towel about stocks going up again. Thus, true capitulation only presents itself when people have stopped actively looking for it.
Think back to early 2020, when the world was shutting down amidst Covid fears. Do you recall many discussions about capitulation during March of that year? I don’t. People were freaking out, liquidity was scarce, and stocks continued to plunge even after an emergency 50 basis point rate cut on March 3rd. The bottom was reached on March 20th, a few days after a further 1% cut at the regularly scheduled March 15th meeting. The fear was visceral, and the monetary response was drastic. Now ask yourself if either of those conditions are in evidence now? (Bear in mind that the Fed hasn’t even begun to reduce its balance sheet and short rates have only recouped about half their 2020 drop.)
The lasting bottoms tend to be accompanied by extreme levels of the VIX index, usually above 40, with steep, parabolic backwardation in the VIX futures. We currently see VIX futures in backwardation, which reflects a relative shortage of available volatility protection, but with peaks in the low 30’s. In February we noted that the levels of backwardation that we saw in the wake of the Ukraine invasion were high, but not sufficient to demonstrate a lasting market bottom. Capitulation occurs when panicky traders will pay seemingly any price for volatility protection and the usual providers have seemingly stepped away from offering it. That leads to extreme spikes in near-term VIX, with a parabolic curve demonstrating that some participants are in real pain. The current bear market is quite unpleasant for many, but we don’t see the sort of existential fear that accompanies capitulation.
Some have pointed to the rising levels of the put/call ratio as pointing to greater risk aversion. That is true to some extent – the ratio has risen quite substantially in recent weeks – but I view the rise shows that speculation via call options has been ebbing rather than a tremendous desire for hedges. Consider the chart below, which shows a five-year history of the S&P 500 Index (SPX) with the daily ratio of put volume to call volume across all options exchanges and the 21-day moving average of that put/call ratio. (I prefer to look at the ratio on a smoothed basis because it is highly volatile, with 21 trading days representing about one calendar month.)
5 Year Daily Chart, SPX (orange) vs. Put/Call Ratio (white) and 21-Day Moving Average of Put/Call Ratio (magenta)
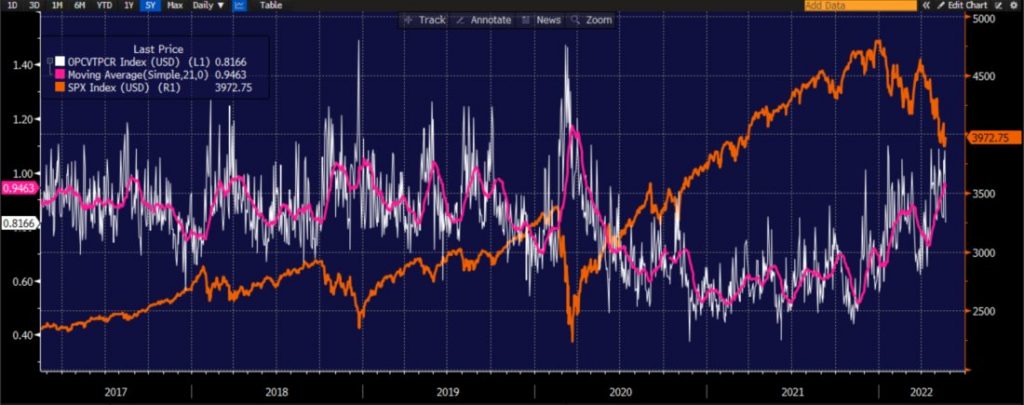
Source: Bloomberg
We see that while the ratio’s moving average is approaching historic peaks, those peaks don’t always correspond to market bottoms. More importantly, the ratio has only now begun to trade at the levels that were considered normal in the pre-Covid environment. Individuals (and many institutions) became enamored with call options as a vehicle for speculation, and it is clear that their love is abating. Thus it is reasonable to assert that the level of the put/call ratio is asserting far greater risk aversion than several months ago, but it is not showing the fearful peaks that it had during prior low points in the past few years.
Today we are seeing a solid bounce from oversold conditions. We didn’t get a 10:1 ratio of declining stocks to advancers, but we did see that ratio of down volume to up volume. Those too are necessary but not sufficient conditions for a lasting bottom, though they can definitely signal the type of oversold conditions that can bring about a solid bounce. We can certainly trade a rally of the type we see today, but keep in mind that bear market rallies are short, sharp and ferocious, which also means that we need to consider when to sell the rips if you bought the dips.
This post first appeared on May 23rd, 2022 on the Traders’ Insight Blog
PHOTO CREDIT: https://www.shutterstock.com/g/maximusdn
Via SHUTTERSTOCK
DISCLOSURE: INTERACTIVE BROKERS
The analysis in this material is provided for information only and is not and should not be construed as an offer to sell or the solicitation of an offer to buy any security. To the extent that this material discusses general market activity, industry or sector trends or other broad-based economic or political conditions, it should not be construed as research or investment advice. To the extent that it includes references to specific securities, commodities, currencies, or other instruments, those references do not constitute a recommendation by IBKR to buy, sell or hold such investments. This material does not and is not intended to take into account the particular financial conditions, investment objectives or requirements of individual customers. Before acting on this material, you should consider whether it is suitable for your particular circumstances and, as necessary, seek professional advice.
The views and opinions expressed herein are those of the author and do not necessarily reflect the views of Interactive Brokers LLC, its affiliates, or its employees.
Any trading symbols displayed are for illustrative purposes only and are not intended to portray recommendations.
In accordance with EU regulation: The statements in this document shall not be considered as an objective or independent explanation of the matters. Please note that this document (a) has not been prepared in accordance with legal requirements designed to promote the independence of investment research, and (b) is not subject to any prohibition on dealing ahead of the dissemination or publication of investment research. S&P 500 Index (SPX), The Standard and Poor’s 500, or simply the S&P 500, is a stock market index tracking the performance of 500 large companies listed on stock exchanges in the United States. The VIX Volatility Index is a popular measure of the stock market’s expectation of volatility based on S&P 500 index options. You cannot invest directly in an index.


