By: Matt Wagner, CFA, Associate, Research
Large-cap growth stocks outperformed small-cap value stocks by over 700 basis points (bps) annualized from 2012 to 2021.1
This stretch of whopping outperformance—a cumulative gain of 508% for large growth versus 211% for small value—stands in stark contrast to the findings of academic research into long-run historical returns.
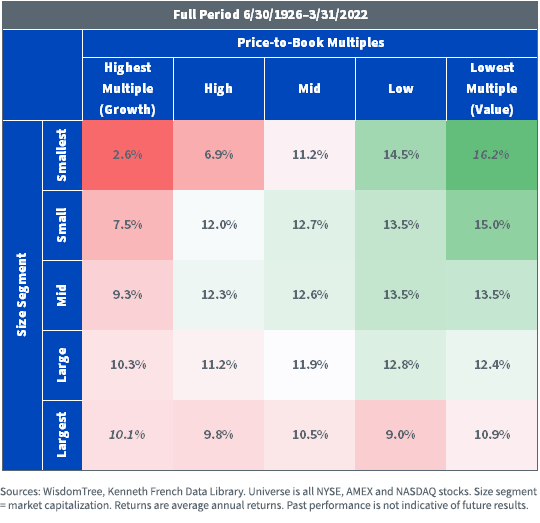
The table below shows the historical returns of U.S. equities sorted into 25 portfolios by price-to-book and market cap from the Kenneth French Data Library.
The returns for these portfolios show a clear trend toward increasing returns for portfolios with lower price-to-book multiples (more value) and smaller market caps.2
The spread in returns between the portfolio in the top right corner (lowest price-to-book and smallest size) and the bottom left corner (highest price-to-book and largest size) was over 600 bps annualized.
Fama/French U.S. 5×5 Portfolios: Size x Price-to-Book
Value Reversal
While it has felt like a long winter for value investors, the reality is that growth outperformance only took off in the four-year stretch between 2017–2020 and was supercharged by the economic circumstances of the Covid-19 pandemic, which favored “stay-at-home” friendly growth stocks.
In fact, between 2012 and 2016, value had a five-year stretch of outperformance over growth across large-, mid- and small-caps.
Trailing 10-Year Style Box Returns: 2012–2021
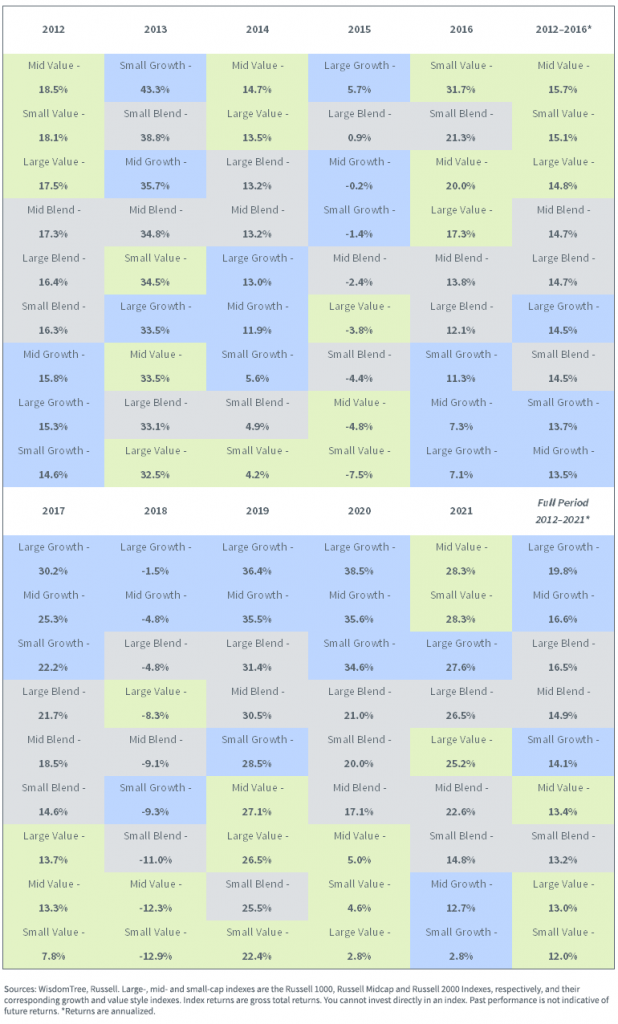
With the resounding comeback of value in recent months, the question is, was the 2017–2020 period of outperformance for growth more of an anomaly, like past periods of sharp outperformance of growth stocks such as the late ‘90s/early 2000s tech bubble?
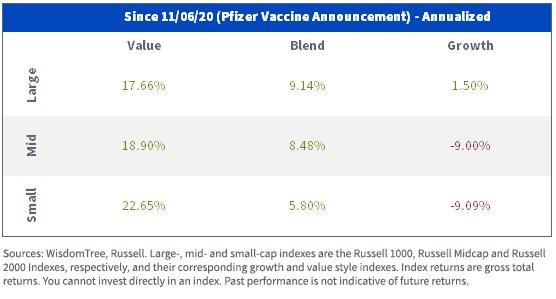
To put the magnitude of this reversal into some context, since the final trading day before the Pfizer vaccine announcement in November 2020, small-cap value has outperformed large-cap growth by an eye-popping 21.15% annualized.
Russell Style Index Returns, as of 5/10/22
Dividends as Measure of Value
With value beating growth by over 17% year-to-date, 3 dividend-oriented indexes, which tend to have high overlap with traditional value indexes, have fared even better. High dividend equities are up over 4% and quality dividend growth stocks have outperformed the S&P 500 by 10.59%.
According to Bank of America Quant Research, the high dividend yield factor was the best-performing factor year-to-date through April of all approximately 50 equity factors it tracks.4
U.S. Factor Return YTD, as of 5/13/22

The outperformance of high dividends is a reversal of what worked in 2020. That year, there was a clear negative relationship between a sector’s dividend yield and total returns as investors favored high-growth “story” stocks.
2020: Low Dividend Yielding Sectors Performed Best
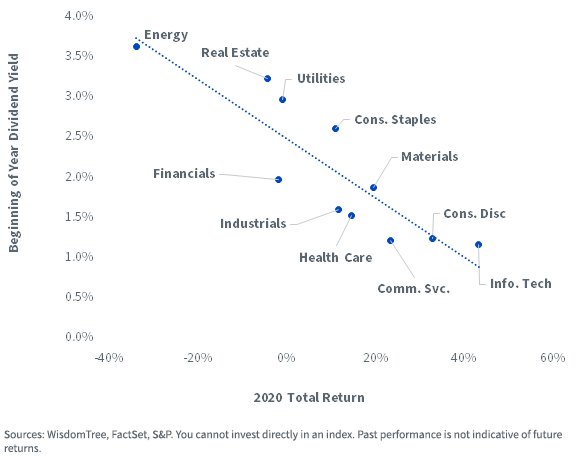
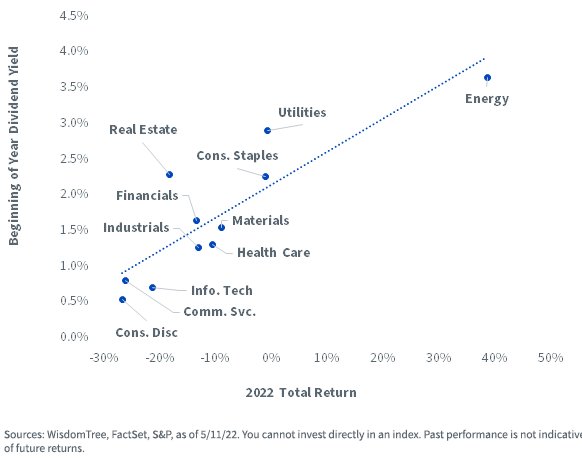
This year, the trendline has been flipped. Now there’s a positive and upward sloping relationship between a sector’s dividend yield and total return, as investors have shifted toward favoring cash flows.
2022 Highest Dividend Yield Sectors Performed Best
What’s Next?
There is a compelling case that the factors contributing to the outperformance of dividend stocks this year seem likely to persist:
- Higher rates: As the Fed aggressively hikes short-term rates it stands to reason investors will prefer the current cash flows of dividends over the uncertainty of non-dividend-paying growth stocks.
- Inflation protection: Dividend growth has historically outpaced inflation. Because stocks are real assets with profits that increase with inflation, dividend payouts also grow with inflation—unlike bond coupons.
- Economic slowdown: The U.S. economy registered negative growth in the first quarter, raising the prospects that the economy may be in—or entering—a soft patch. During economic slowdowns investors tend to prefer the relative safety of dividend payments.
For more information on dividends and the performance of dividend-paying equities, check out our monthly Dividend Monitor.
1 Comparing Russell 2000 Value to Russell 1000 Growth Total Returns.
2 The outlier to this trend is the underperformance of smaller market-cap portfolios in the highest and high price-to-book segments. The expected positive size effect does not offset the negative expected effect of a higher price-to-book multiple and leads to lower returns in the highest price-to-book portfolios when going down the size segments.
3 Comparing Russell 1000 Value to Russell 1000 Growth Total Returns.
4 Bank of America Global Research, “Quantitative Profiles: Welcome to a Total Return World,” 5/11/22.
This post first appeared on May 19th, 2022 on the WisdomTree Blog
PHOTO CREDIT: https://www.shutterstock.com/g/Costello77
Via SHUTTERSTOCK
There are risks involved with investing, including possible loss of principal. Foreign investing involves currency, political and economic risk. Funds focusing on a single country, sector and/or funds that emphasize investments in smaller companies may experience greater price volatility. Investments in emerging markets, currency, fixed income and alternative investments include additional risks. Please see the prospectus for discussion of risks.
Past performance is not indicative of future results. This material contains the opinions of the author, which are subject to change, and should not to be considered or interpreted as a recommendation to participate in any particular trading strategy, or deemed to be an offer or sale of any investment product and it should not be relied on as such. There is no guarantee that any strategies discussed will work under all market conditions. This material represents an assessment of the market environment at a specific time and is not intended to be a forecast of future events or a guarantee of future results. This material should not be relied upon as research or investment advice regarding any security in particular. The user of this information assumes the entire risk of any use made of the information provided herein. Neither WisdomTree nor its affiliates, nor Foreside Fund Services, LLC, or its affiliates provide tax or legal advice. Investors seeking tax or legal advice should consult their tax or legal advisor. Unless expressly stated otherwise the opinions, interpretations or findings expressed herein do not necessarily represent the views of WisdomTree or any of its affiliates.
The MSCI information may only be used for your internal use, may not be reproduced or re-disseminated in any form and may not be used as a basis for or component of any financial instruments or products or indexes. None of the MSCI information is intended to constitute investment advice or a recommendation to make (or refrain from making) any kind of investment decision and may not be relied on as such. Historical data and analysis should not be taken as an indication or guarantee of any future performance analysis, forecast or prediction. The MSCI information is provided on an “as is” basis and the user of this information assumes the entire risk of any use made of this information. MSCI, each of its affiliates and each entity involved in compiling, computing or creating any MSCI information (collectively, the “MSCI Parties”) expressly disclaims all warranties. With respect to this information, in no event shall any MSCI Party have any liability for any direct, indirect, special, incidental, punitive, consequential (including loss profits) or any other damages (www.msci.com)
Jonathan Steinberg, Jeremy Schwartz, Rick Harper, Christopher Gannatti, Bradley Krom, Tripp Zimmerman, Michael Barrer, Anita Rausch, Kevin Flanagan, Brendan Loftus, Joseph Tenaglia, Jeff Weniger, Matt Wagner, Alejandro Saltiel, Ryan Krystopowicz, Kara Marciscano, Jianing Wu and Brian Manby are registered representatives of Foreside Fund Services, LLC.
WisdomTree Funds are distributed by Foreside Fund Services, LLC, in the U.S. only.
You cannot invest directly in an index.
Russell 2000 Value measures the performance of the small-cap value segment of the U.S. equity universe. It includes those Russell 2000 Index companies with lower price-to-book ratios and lower forecasted growth values.
Russell 1000 Growth measures the performance of the 1,000 largest companies by market capitalization in the Russell 3000 Index.
WisdomTree U.S. Dividend Growth Index is a fundamentally weighted index designed to track the performance of dividend-paying companies in the U.S. that WisdomTree believes have the potential to increase their dividends due to certain factors, which include estimated earnings growth, return on equity and return on assets. Weighting is by indicated cash dividends.
The MSCI USA Minimum Volatility Index aims to reflect the performance characteristics of a minimum variance strategy applied to the large and mid cap USA equity universe.
The MSCI USA Sector Neutral Quality Index refers to the MSCI USA Quality Index which is a large and mid cap US equity index aiming to capture the performance of quality growth stocks. This index screens its parent index, the MSCI USA Index, for ROE, stable year-over-year earnings growth, and low financial leverage. This index seeks to match the sector exposure of the MSCI USA Index.
MSCI Momentum Index : designed to embody the performance of an equity momentum strategy by emphasizing stocks with high price momentum, while also maintaining reasonably high trading liquidity, investment capacity and moderate investment turnover.