

By: Steve Sosnick, Chief Strategist at Interactive Brokers
We’ve all heard the phrase “Sell in May and Go Away.” The adage is cute, but quite incomplete. It doesn’t tell you what to sell and where to go. As we find ourselves at the start of that calendar month, it behooves us to look back at this year’s rocky April and consider what is likely to lie ahead as this month unfolds.
We start May after one of the worst months for asset prices in over a decade. Interestingly, if we take a look at the S&P 500 Index (SPX) on a year-to-date basis, we see that we have reverted to the low end of a trading range that was established in February. Quite frankly, a good portion of April’s fall can be blamed on the sharp rally at the end of March that took equity prices off their year lows.
SPX 4 Month Daily Bars
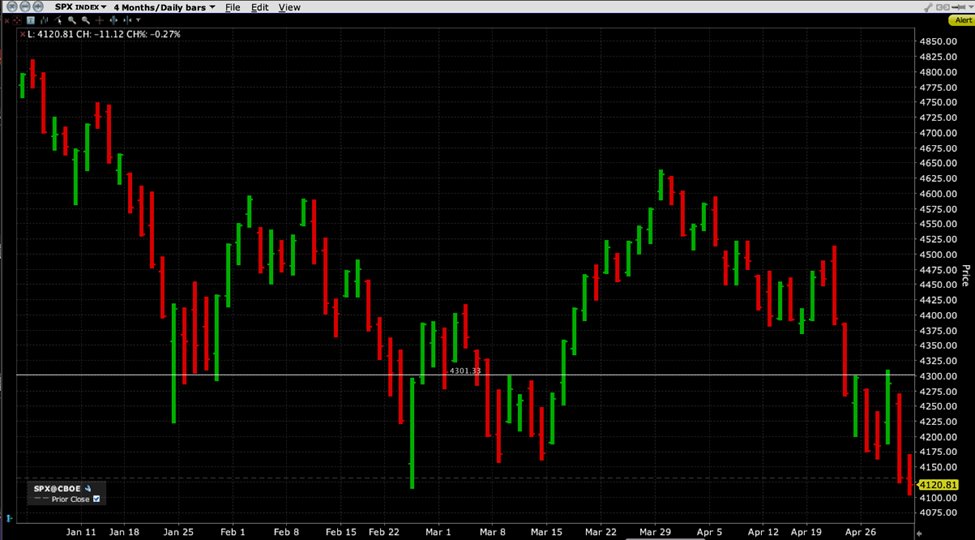
Source: Interactive Brokers
At the time, we questioned the sustainability of late March’s rally, writing:
“It remains to be seen whether the current rally represents a meaningful turning point or simply a bear market rally. If it proves to be a bear market rally, it certainly fits in with the typical “short, sharp and ferocious” rubric. My inclination is to infer that the bounce was more the result of technical and timing factors rather than a paradigm shift.”
In hindsight, it appears that March’s rally was indeed the result of technical and timing factors rather than the start of a sustained move higher. More simply, we can think of the bounce as yet another bout of “socially acceptable volatility” – the tendency of investors to be less concerned by sharp upward moves than similar moves to the downside. Markets are supposed to go up, right? But volatility is calculated whether markets go up or down. It tends to concern most people only when volatility pushes prices lower.
So what does one do after a sharp downward adjustment that took SPX to a fresh low for 2022 and the index appears liable to test the psychologically important 4,000 region? Normally, equity investors would consider alternative asset classes like fixed income and commodities. The problem is that fixed income is in the midst of its own rocky period and real US treasury yields remain negative. Commodities may offer absolute return, but in many cases they have been even more volatile than equities. That makes most of them a poor alternative for a risk-averse investor. Yet there is one meaningful exception.
Gold, the classic inflation hedge fell in April alongside other risk assets, though to a much lesser extent. After peaking around $2,070 in early March, spot gold is about $200 lower since then. But most of that decline occurred while stocks rose during March. In April, gold fell by about 2%. That’s not a bad result, all things considered. It is even more impressive when we consider that gold often acts like an “anti-dollar” rather than a pure inflation hedge, yet the U.S. Dollar Index (DXY) rose by about 5% during that time period. On an absolute basis, gold may have been another loser, but it did well on a relative basis.
As for another purported hedge, cryptocurrencies failed the test miserably. Bitcoin fell by 19% in April, exceeding even the NASDAQ 100 Index (NDX), which fell by 15% during the month. A few months ago we debunked the notion of bitcoin as a hedge after asserting that it was just another risk asset. There is nothing I’ve seen recently to dissuade me of that notion.
Maybe the best place to go is boring old cash. Yes, in an inflationary environment it loses its purchasing power, but it is losing it more slowly than other assets. For example, the fiat dollar outperformed bitcoin by 19% in April, no? And cash outperformed stocks and bonds by a significant margin too. With interest rates likely to rise by 50 basis points this week, cash looks less bad as an alternative.
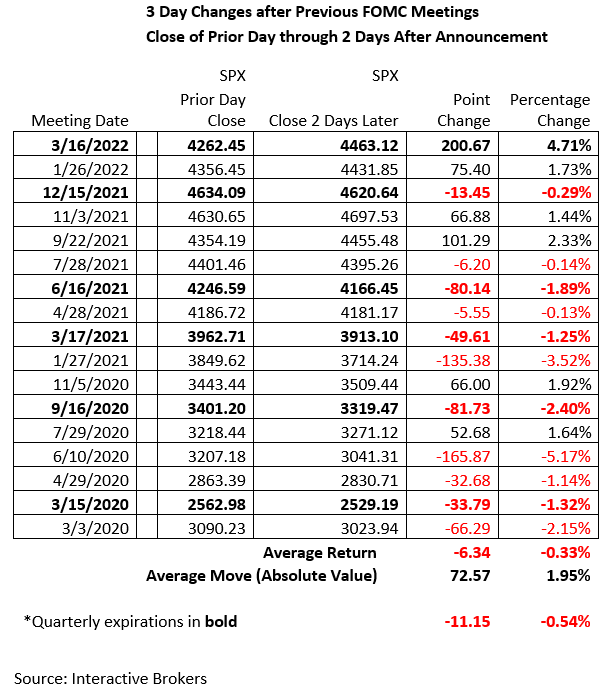
As for when to go away, this week will be critical. It would not surprise me in the least if we get a snapback rally after Wednesday’s FOMC meeting. Traders have tended to get ahead of themselves before recent Fed announcements. As the table below shows, as the Fed was busily adding liquidity to the economy at a record pace since March 2020, we saw SPX close lower in the three-day period following 10 of 12 meetings. This came in the face of a huge rally in stocks during that time. When the Fed began to switch to less accommodative rhetoric in September 2021 that shifted the pattern. Since then 4 of 5 post meeting periods have seen a higher close. If that pattern holds once more amidst this current negativity and volatility, we could get a short-term snapback. We expect to discuss this more between now and Wednesday’s meeting.
This post first appeared on May 2, 2022 on the Traders’ Insight blog
PHOTO CREDIT: https://www.shutterstock.com/g/stuartmiles
Via SHUTTERSTOCK
DISCLOSURE
Investing involves risk, including the possible loss of principal. Diversification does not ensure a profit nor guarantee against a loss.
This material represents an assessment of the market environment at a specific point in time and is not intended to be a forecast of future events, or a guarantee of future results. This information is not intended to be individual or personalized investment or tax advice and should not be used for trading purposes. Please consult a financial advisor or tax professional for more information regarding your investment and/or tax situation.
The Standard and Poor’s 500, or simply the S&P 500, is a stock market index tracking the performance of 500 large companies listed on stock exchanges in the United States. Investors cannot invest directly into indexes.

