By: Pierre Debru, Head of Quantitative Research & Multi Asset Solutions at WisdomTree in Europe
The year 2022 opened with a sharp decline. The war in Ukraine added further uncertainty to an already complex situation with entrenched inflation and upcoming rate hikes. In this installment of the WisdomTree Quarterly Equity Factor Review, we aim to shed some light on how equity factors behaved in the first quarter of 2022 and how they may have impacted investors’ portfolios.
- Value and high dividend dominated in most regions.
- Pushed by increasing volatility and nervousness in the market, minimum volatility followed closely behind.
- Momentum and size suffered the most over the quarter, delivering underperformance across regions.
- Quality strategies delivered mixed results depending on their portfolio’s overall valuation.
Looking forward, uncertainty continues to rise, whether economic or geopolitical. Investors face a trifecta of worries: rate hikes, inflation and volatility. Those market conditions should continue to favor value, high-dividend and quality stocks.
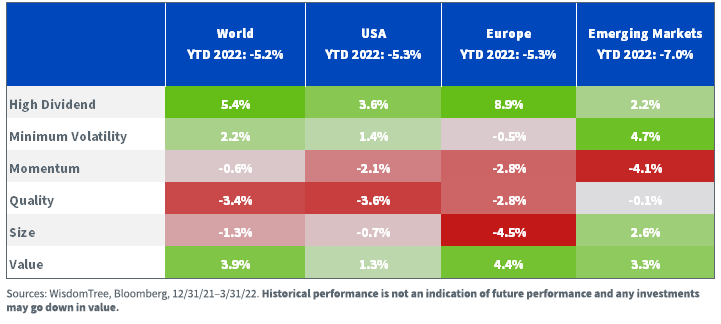
Performance in Focus: Value and High Dividend Lead the March
In Q1 2022, equity markets took stock of a changing economic and geopolitical landscape. This led to a sharp decline in the first two months of the year, and despite a rebound in March, the MSCI World Index lost -5.2%. Unusually, the U.S. and European markets delivered the same performance of -5.3%. Emerging markets lagged, impacted, in part, by the zeroing of most Russian stocks at the start of the war in Ukraine.
Factor performance in Q1 2022 has been driven by high inflation, the upcoming rate hike cycle and the war in Ukraine. Faced with such a brutal landscape, some factors did well, some did not:
- Value and high dividend dominated in most regions, and are the only factors that managed to outperform in all four geographies over the quarter.
- Pushed by increasing volatility and nervousness in the market, min volatility followed closely and ended up winning in emerging markets. Counterintuitively, it did worse in Europe.
- Momentum and size suffered the most over the quarter, delivering underperformance across regions.
- Quality is an interesting case. The MSCI Quality indexes used here as a proxy for the factor have suffered over the quarter, underperforming by 2% or 3% in developed markets. However, in this instance, the definition of quality and the criteria used would have hugely impacted the result. Quality, left unattended, tends to tilt toward growth (investors pay for quality, after all). This is the case for the MSCI indexes and explains the underperformance in a value-dominated market. Other ways to create quality strategies, focusing on profitability and dividend growers, for example, have fared better over the period.
Figure 1: Equity Factor Outperformance in Q1 2022 Across Regions
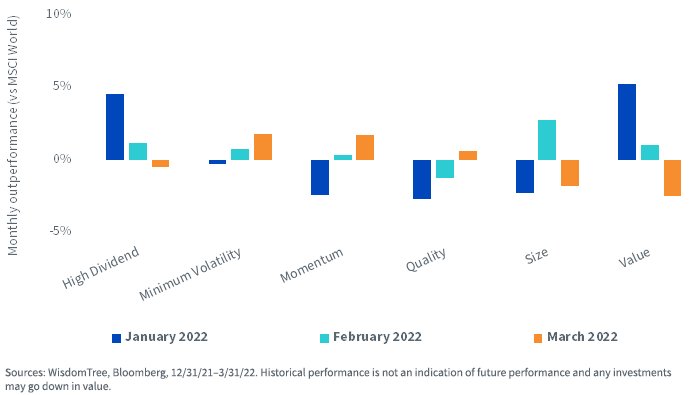
Looking deeper into factors’ behavior over the quarter, we notice two distinct periods. In January and February, markets’ main concerns focused on rate hikes and inflation. In January, we saw expectations of the number of hikes by the Federal Reserve skyrocket. This led to a focus on low duration equities, away from high duration equities.
Looking through holdings in different factors, this translates into tailwinds for value and high dividend and even larger headwinds for growth. This is what we observe in the monthly returns, with value and high dividend outperforming in both months. However, March saw a slight shift in perspective, with markets starting to worry about the effect of rate hikes on growth and the recovery. The inversion of the yield curve put an emphasis on such worry, and this led to the continued increase in market volatility. Therefore March saw a turn toward more risk-off assets with min volatility and quality benefitting while more cyclical factors like size and value suffered to a greater degree.
Figure 2: Month-to-Month Outperformance of Equity Factors in Developed Markets
Factors, inflation and rate hikes
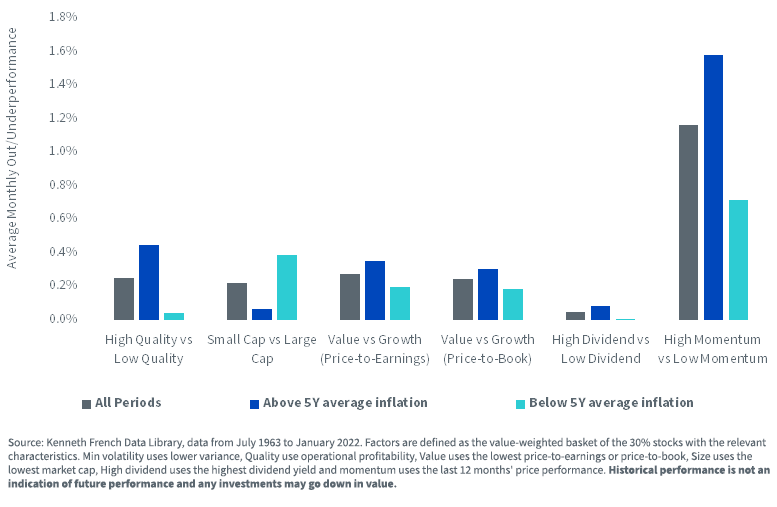
Inflation is back after a 15-year, if not 30-year, hiatus. In some way, markets and investors have forgotten how equities behave in an inflationary environment. As always, history is a good teacher.
Figure 3 illustrates the average monthly outperformance of U.S. equities organized by factor pairs in periods of above-average or below-average inflation. Historically, it is quite clear that:
- High-quality stocks have created most of their historical outperformance compared to low-quality stocks in periods of higher inflation.
- Similarly, value stocks, high dividend stocks and momentum stocks have also created more outperformance in periods of above-average inflation but less aggressively than quality.
Figure 3: Factors’ Average Outperformance versus U.S. Equity Markets Based on Inflation Regimes by Pairs
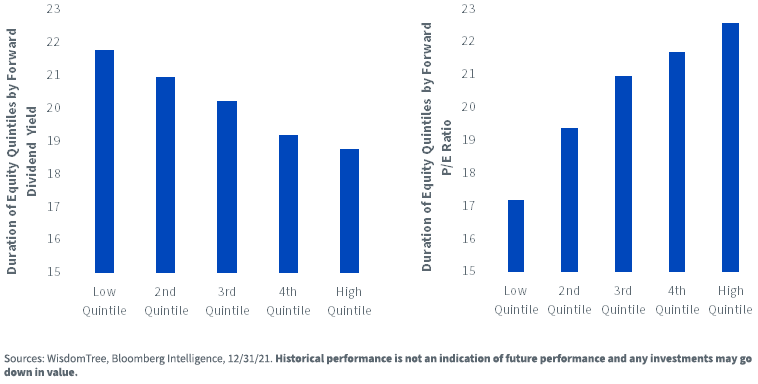
Implied duration is an interesting indicator of potential resistance to a rate hike cycle. Figure 4 exhibits the duration of equity stocks using a concept called ‘implied equity duration,’ which measures the sensitivity of a stock just like the Macaulay duration measures interest rate sensitivity of bonds. It applies an extended duration calculation formula using forecasted cash flows for the company where cash flows are predicted using earnings and changes in book value. Stocks are then organized in equal-weighted quintiles depending on their estimated forward dividend yield or forward price-to-earnings ratios (P/E). We observe that:
- The quintile with the highest forward dividend stocks has the lowest duration on average, and the relationship is monotonic, with duration decreasing as the dividend yield increases.
- The quintile with the cheapest stocks has the lowest duration on average, and the relationship is monotonic, with duration increasing as the P/E increases.
In line with recent performance, this analysis points to high dividend and value stocks as being resistant to a scenario of rate hikes.
Figure 4: Estimated Implied Duration of Equities by Dividend and P/E Ratio Quintiles in the S&P 500
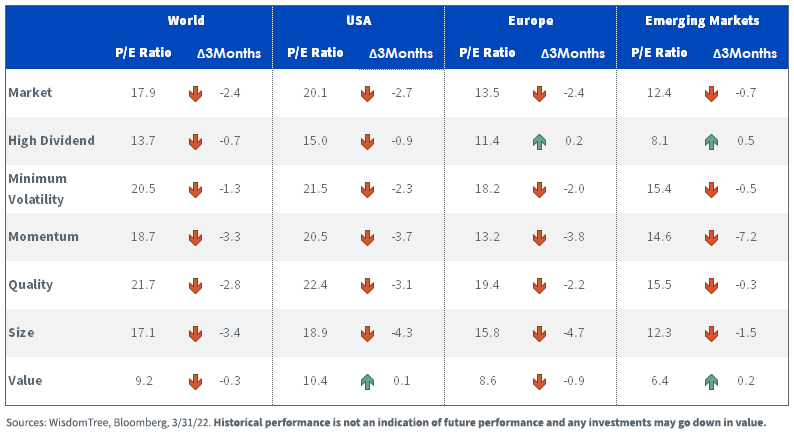
Valuations continue to come down across the board
In Q1 2022, valuations have decreased almost across the board for factors. Only high dividend stocks in Europe and emerging markets and U.S. value stocks have seen a slight increase in P/E ratios. Size and momentum have seen the sharpest drops.
Figure 5: Historical Evolution of P/E Ratios of Equity Factors
Looking forward, economic and geopolitical uncertainty will likely increase. . Inflation, driven by commodity prices that are themselves stoked by the war in Ukraine, shows no sign of slowing down. In response, central banks are becoming increasingly hawkish, with the Federal Reserve planning to hike and reduce their balance sheet aggressively at the same time. This leaves investors with a triple worry: rate hikes, inflation and volatility that should continue to favor value, high dividend and quality stocks.
Important Risks Related to this Article
Pierre Debru is an employee of WisdomTree UK Limited, a European subsidiary of WisdomTree Asset Management Inc.’s parent company, WisdomTree Investments, Inc.
World is proxied by MSCI World net total return index. U.S. is proxied by MSCI USA net TR index. Europe is proxied by MSCI Europe net TR Index. Emerging markets is proxied by MSCI Emerging Markets net TR index. Minimum volatility is proxied by the relevant MSCI Min Volatility net TR index. Quality is proxied by the relevant MSCI Quality net TR index.
Momentum is proxied by the relevant MSCI Momentum net TR index. High dividend is proxied by the relevant MSCI High Dividend net TR index. Size is proxied by the relevant MSCI Small Cap net TR index. Value is proxied by the relevant MSCI Enhanced Value net TR index.
This post first appeared on April 25, 2022 on the WisdomTree blog
PHOTO CREDIT: https://www.shutterstock.com/g/stk08
Via SHUTTERSTOCK
DISCLOSURE
Investing involves risk, including the possible loss of principal. Diversification does not ensure a profit nor guarantee against a loss.
This material represents an assessment of the market environment at a specific point in time and is not intended to be a forecast of future events, or a guarantee of future results. This information is not intended to be individual or personalized investment or tax advice and should not be used for trading purposes. Please consult a financial advisor or tax professional for more information regarding your investment and/or tax situation.
The MSCI World Index is a free float-adjusted market capitalization weighted index that is designed to measure the equity market performance of developed markets. MSCI Quality indexes refers to the MSCI USA Quality Index which is a large and mid cap US equity index aiming to capture the performance of quality growth stock. The Index screens its parent index, the MSCI USA Index for ROE, stable year-over-year earnings growth, and low financial leverage. The Standard and Poor’s 500, or simply the S&P 500, is a stock market index tracking the performance of 500 large companies listed on stock exchanges in the United States. Investors cannot invest directly into indexes.