The bull market appears alive and well as stocks continue to climb to new records and investors feel confident that central banks have their backs.
The U.S. stock market as measured by the Dow Jones Industrial Average has rallied about 160% from the financial crisis low in 2009.
The Dow is setting fresh all-time highs after it dropped over 50% from its 2007 peak during the credit crisis.
Since the benchmark’s inception in 1896, there have only been three bear markets that resulted in a 50% decline in the Dow, including the 2007-2009 washout. For the two other extreme bear markets, we have to go back to the 1930s and 1940s.
History lessons
Of course, that’s a very limited sample size — yet the rallies that followed these big bear markets tend to follow a similar script.
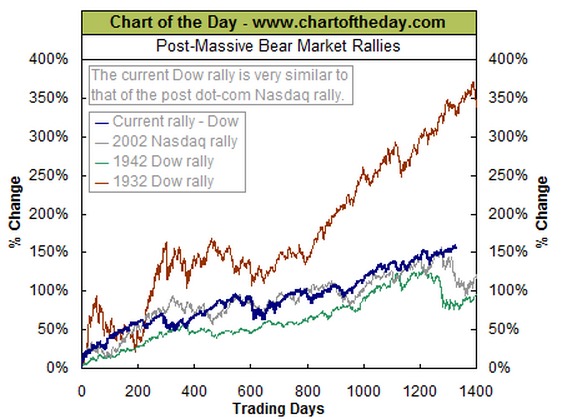
History never repeats exactly, but it might provide helpful context to compare the current post-bear-market rally to those that have occurred in the past.
We can also look at how the Nasdaq Composite recovered after it plunged nearly 80% during the dot-com crash.
It turns out the current bull market so far actually looks a lot like the Nasdaq rally after the tech wreck.
“The current Dow rally has followed the post dot-com bust rally of the Nasdaq that began back in 2002 fairly closely and held to a general post-massive bear market rally pattern — rally during the first 300 trading days, trade in a relatively flat choppy manner up until around 600 trading days and then re-embark on the second leg of the rally,” according to chartoftheday.com.
The death of volatility?
That second leg of the rally this time around has been good to investors, and also notable for its recent lack of volatility. The Dow hasn’t suffered a 10% correction since 2011.
It looks like investors expect the trend to continue with a quiet summer in the markets.
It has been several weeks since the S&P 500 has experienced a 1% move, the longest streak since 1995, although there have been many prolonged calm periods if you go further back in history.
Meanwhile, the CBOE Volatility Index (VIX), known as Wall Street’s fear gauge, has dropped to multiyear lows and is even threatening to fall into single digits.

The market’s steady march higher has confounded individual investors scarred by the financial crisis who don’t trust the rally.
On the other hand, a historical argument could be made that the current move higher is living on borrowed time despite the recent lack of market volatility.
“It is worth noting that for the post-massive bear market rallies that began in 1942 and 2002, a major correction began after 1,200 to 1,300 trading days had passed,” according to chartoftheday.com. “The post-financial crisis rally is currently over 1,300 trading days old.”
For more on Covestor’s services, visit Covestor.com or try a free trial.
Photo credit: shanmuga varadan asoka via Flickr Creative Commons
DISCLAIMER: The information in this material is not intended to be personalized financial advice and should not be solely relied on for making financial decisions. All investments involve risk, the amount of which may vary significantly. Past performance is no guarantee of future results.