By: Michael Kramer
This will be an interesting week. After all, the S&P 500 is not often down for five consecutive weeks, so one has to think this might be the week the market attempts a rebound. From what I can tell, the last time it declined for at least five weeks in a row was in April and early May 2022, and before that, such occurrences seemed rare.
The index also closed below its lower weekly Bollinger Band, which indicates that it is pretty oversold at these levels, suggesting a potential bounce.
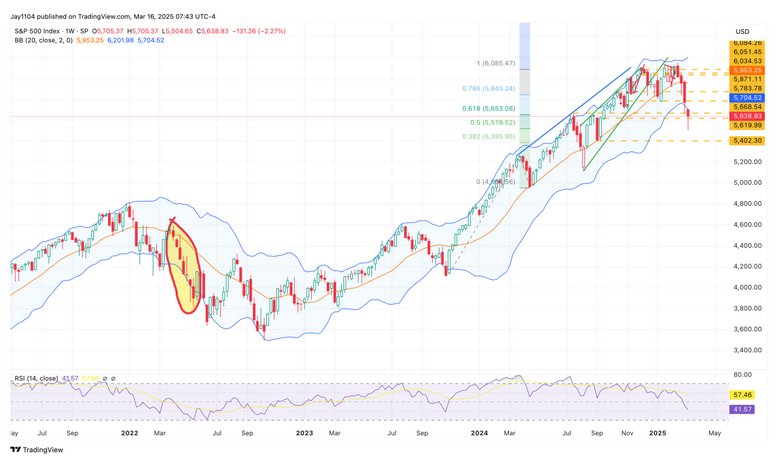
Can we expect a bounce? There’s a good chance, but whether it happens is another question. Technicals may not apply in an environment that seems to be experiencing a buyer’s strike. More importantly, the Bank of Japan is likely to set the tone for future rate hikes, which could significantly impact USD/JPY. While the BOJ is not expected to raise rates this week, It is expected that they will signal further hikes later this year. This will put the spread between U.S. Treasury rates and JGBs in focus, which will play a major role in determining where USD/JPY moves.
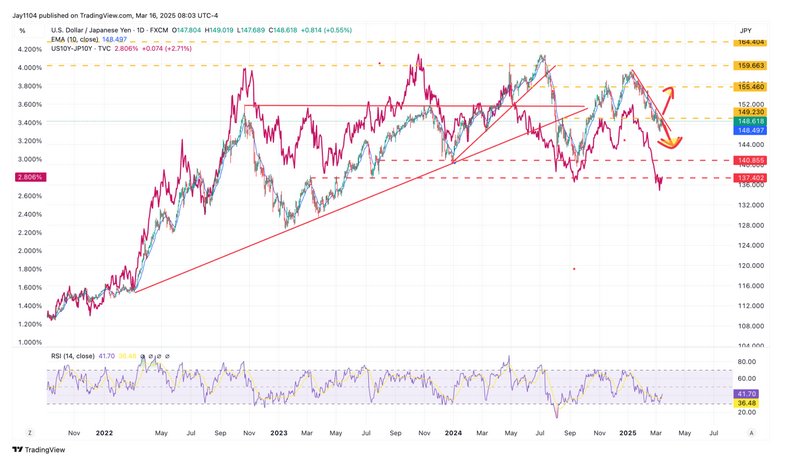
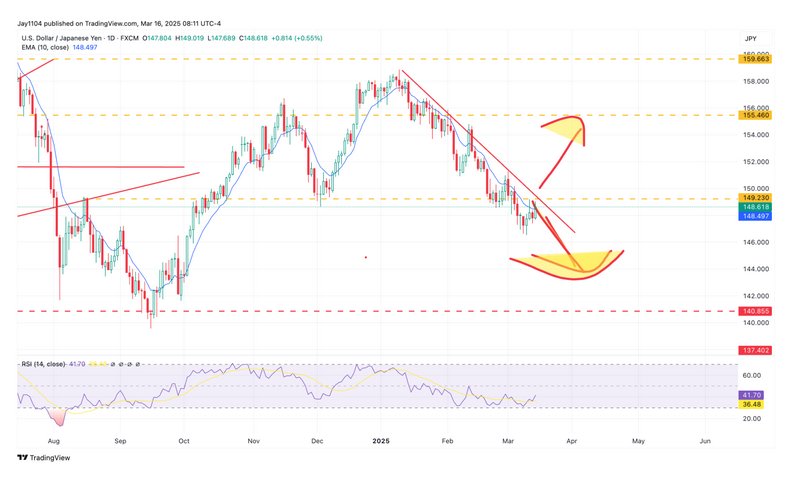
The USD/JPY is at crucial level and will significantly impact what happens next. However, predicting its direction from here isn’t easy, as it’s facing a downtrend, horizontal resistance, and the 10-day exponential moving average. There is strong resistance around 149 to 149.25, and if the BOJ signals more rate hikes—as they should—the general trend in USD/JPY is likely to remain lower, meaning the yen strengthens.
I think a stronger yen suggests the potential for lower stock prices, while a weaker USD/JPY means higher stock prices. That’s how the relationship has played out recently, and I don’t believe we’ve reached a point where it should change or stop working.
Talking about liquidity and currency—have you ever seen those dumb charts on social media where they overlay “Global M2” with Bitcoin, making it look like Bitcoin is following “Global M2”? First, M2 values are typically updated only once a month, so there is no precise way to know where M2 is between the monthly updates. Secondly, global M2 is measured in U.S. dollar terms, meaning the “Global M2” is essentially just a dollar proxy. Essentially, you take Eurozone M2 and convert it from euro to dollars, Japan’s M2 to dollars, and so on, so if the dollar weakens against the euro, then the value of M2, when measured in dollars, will increase if M2 is denominated initially in euros, and vice versa.
So, at least since Q4 2023, the chart shows that Bitcoin, in this case, has traded about 20 days behind the DXY Index.
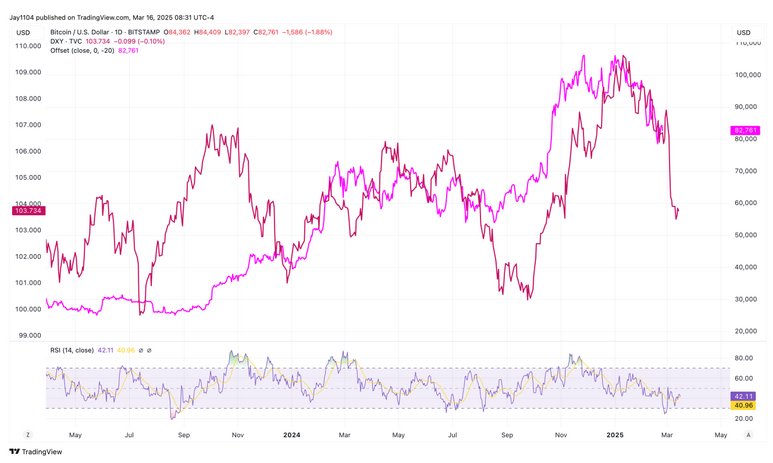
That is likely because, perhaps more importantly, foreign investors were selling local currency to buy dollars to invest in Bitcoin, giving them the added advantage of gaining dollar strength and bitcoin gains. That trade appears to be unraveling.
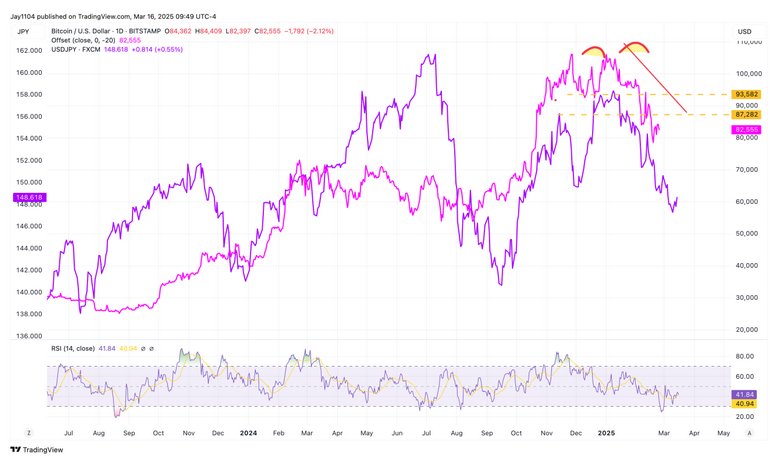
This becomes more apparent when you examine the relationship between the USDJPY and Bitcoin, with the 20-day lag.
And with the EURUSD, but instead, use USDEUR for visual purposes.
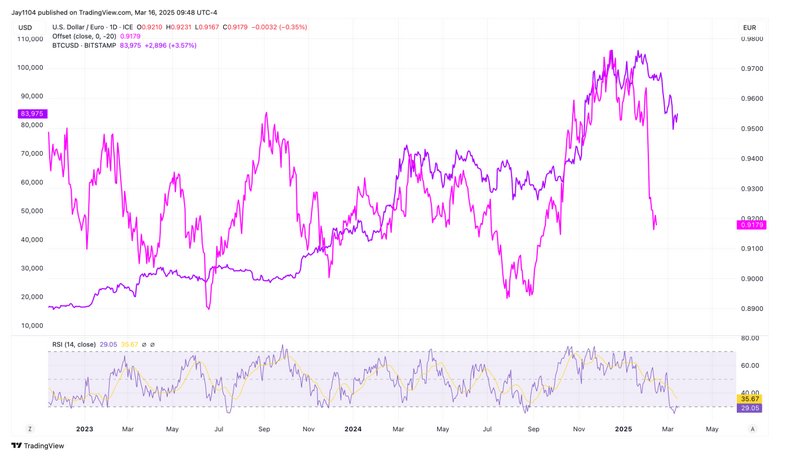
Again, it may appear in some ways to be an M2 play, but it is a dollar proxy. But then again, I could be completely wrong. You can decide for yourself; you know what I think, at least.
Originally posted on March 16, 2025 on Mott Capital blog
PHOTO CREDIT: https://www.shutterstock.com/ai-image-generator
VIA SHUTTERSTOCK
DISCLOSURES
This report contains independent commentary to be used for informational and educational purposes only. Michael Kramer is a member and investment adviser representative with Mott Capital Management. Mr. Kramer is not affiliated with this company and does not serve on the board of any related company that issued this stock. All opinions and analyses presented by Michael Kramer in this analysis or market report are solely Michael Kramer’s views. Readers should not treat any opinion, viewpoint, or prediction expressed by Michael Kramer as a specific solicitation or recommendation to buy or sell a particular security or follow a particular strategy. Michael Kramer’s analyses are based upon information and independent research that he considers reliable, but neither Michael Kramer nor Mott Capital Management guarantees its completeness or accuracy, and it should not be relied upon as such. Michael Kramer is not under any obligation to update or correct any information presented in his analyses. Mr. Kramer’s statements, guidance, and opinions are subject to change without notice. Past performance is not indicative of future results. Neither Michael Kramer nor Mott Capital Management guarantees any specific outcome or profit. You should be aware of the real risk of loss in following any strategy or investment commentary presented in this analysis. Strategies or investments discussed may fluctuate in price or value. Investments or strategies mentioned in this analysis may not be suitable for you. This material does not consider your particular investment objectives, financial situation, or needs and is not intended as a recommendation appropriate for you. You must make an independent decision regarding investments or strategies in this analysis. Upon request, the advisor will provide a list of all recommendations made during the past twelve months. Before acting on information in this analysis, you should consider whether it is suitable for your circumstances and strongly consider seeking advice from your own financial or investment adviser to determine the suitability of any investment.