

By: Michael Kramer
It was not a great day for the stock market—just a lot of sideways chop, with the index stuck below 5,620. The cooler-than-expected CPI report initially pushed equities higher after the news, but once implied volatility reset, the rally fizzled, and choppy price action took over.
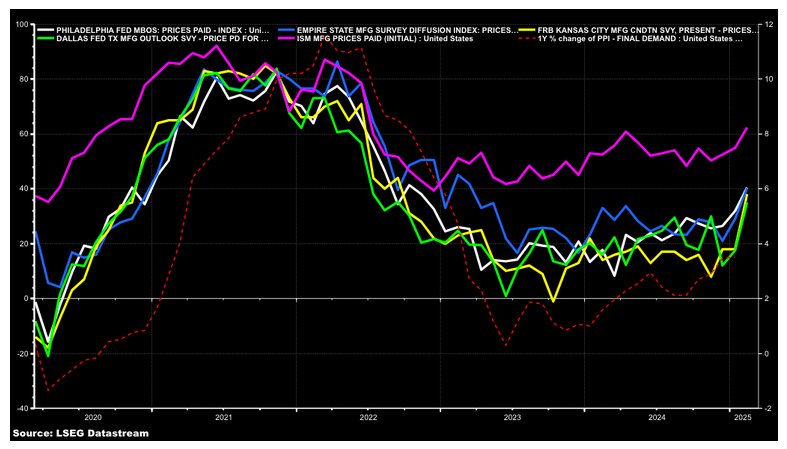
Tomorrow also carries some added risk, with the underappreciated PPI report due in the morning. Estimates forecast the headline index to rise by 0.3% m/m, down from 0.4% in January, while increasing by 3.3% y/y, down from 3.5% in January. Most regional Fed data and the ISM manufacturing report showed solid inflation acceleration in February, so there’s a risk that PPI will come in hot—likely more than the market is currently pricing in.
Rates generally rose today because some components that go into PCE were less favorable in the CPI report than the overall numbers suggested. So again, the PPI report shouldn’t be overlooked.
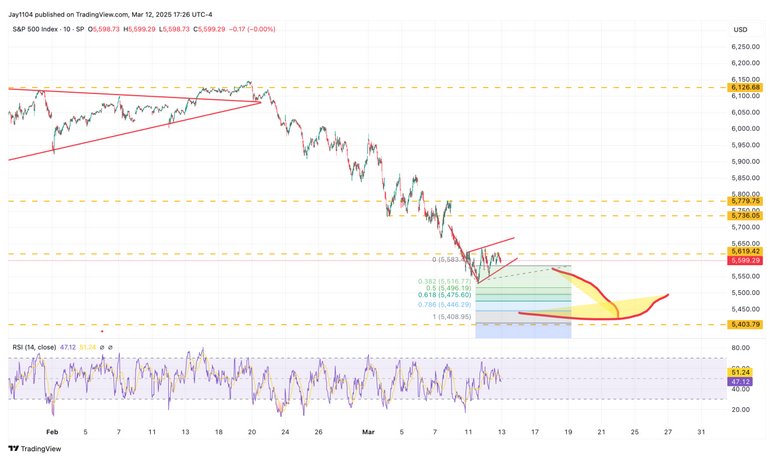
In the meantime, the S&P 500 just kept bouncing off of 5620 today. When you combine that with some of the more recent tops and bottoms, you can argue that a bear flag has formed on the 10-minute chart. If that is true, we can make a case for a drop to 5,400.
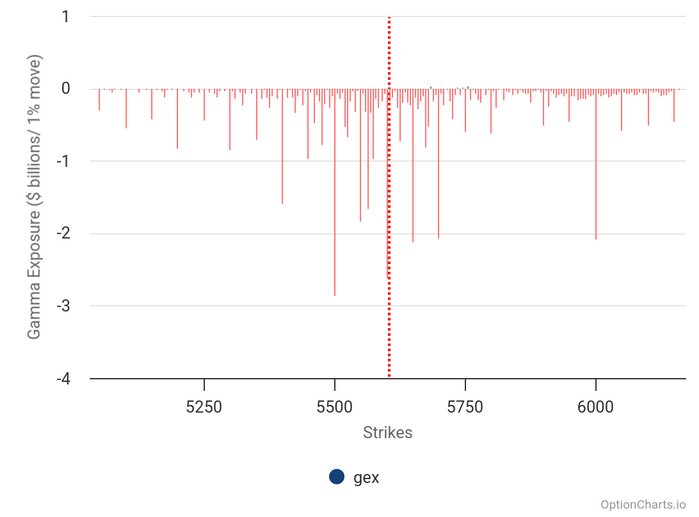
I’m already starting to hear about the JPM collar and the put that lives at 5,565. Based on what I see, I don’t think that should become a topic until after we pass the quarterly opex on March 21. If the market wants to head to 5,500, there is not much on the way down that can prevent that from happening from an options perspective. There is just a lot more put gamma at 5,500 than anywhere else, and it could work like a magnet. By the time we pass OPEX, the JPM collar may not even be a factor.
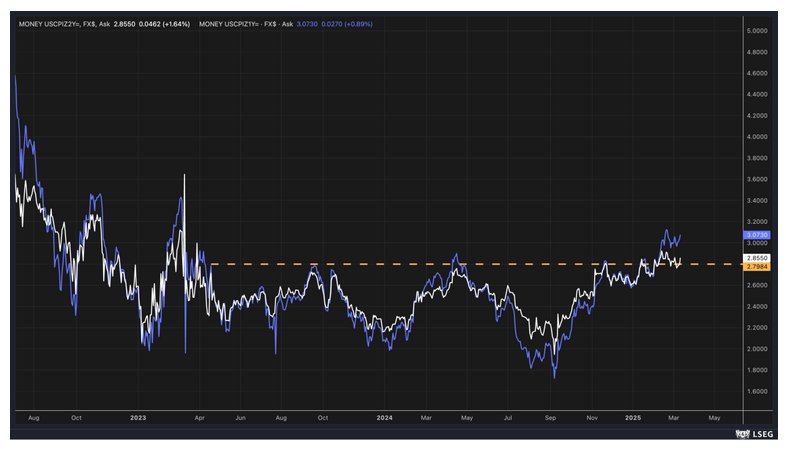
In the meantime, 1- and 2-year inflation swaps were higher today, and for some reason, they both look like they want to go even higher.
This is probably because copper made its highest close since June 2024 and perhaps because it appears to be breaking out of an ascending triangle, possibly heading to $5 and beyond.
Despite all the worries about a recession and the coming “supply glut” of oil, it still can’t break support at that $66 dollar region. Someone big clearly lives there, and now you can start to say that momentum is shifting from bearish to bullish. I wouldn’t be surprised to see oil head back over $70.
If oil goes over $70 and copper goes to $5, we will go from having growth worries to growth and inflation worries. What makes it all worse is that 10-year rates won’t be heading lower; they’ll be heading higher, even if President Trump doesn’t like it, because the 10-year rate trades with oil and where the dollar goes will set the stage for the stagflation calls. It will not be good if the dollar drops as 10-year rates rise.
Originally posted on March 12, 2025. See Mott Capital Management blog for more charts.
Terms by CHATGPT:
1. Sideways chop – A term used in technical analysis to describe a market that moves in a narrow range without a clear trend, characterized by frequent small price fluctuations.
2.CPI (Consumer Price Index) – A key economic indicator that measures the average change in prices paid by consumers for goods and services over time, often used to gauge inflation.
3.Implied volatility – A metric in options pricing that reflects market expectations of future volatility, often used to assess risk and uncertainty.
4.PPI (Producer Price Index) – An economic indicator that measures the average change in selling prices received by domestic producers for their goods and services, often a leading indicator of consumer inflation.
5.m/m (Month-over-month) & y/y (Year-over-year) – m/m measures the percentage change in a data point from one month to the next, while y/y compares the same data point from the same month in the previous year.
6.ISM Manufacturing Report – A monthly economic report from the Institute for Supply Management (ISM) that tracks manufacturing sector activity, often used as a leading indicator of economic trends.
7.PCE (Personal Consumption Expenditures Price Index) – The Federal Reserve’s preferred inflation gauge, measuring price changes in consumer goods and services.
8.Bear flag – A bearish technical chart pattern that suggests a continuation of a downward trend after a short period of consolidation.
9.JPM collar – A reference to a hedging strategy used by JPMorgan (JPM), involving a combination of options contracts to limit downside risk while capping upside potential.
10.Put (Options contract) – A financial contract giving the holder the right (but not the obligation) to sell an asset at a specified price before expiration, often used as a hedge against market declines.
11.OPEX (Options Expiration) – The date when options contracts expire, often leading to increased market volatility as traders adjust their positions.
12.Put gamma – A measure of how sensitive an option’s delta (price movement relative to the underlying asset) is to changes in the underlying price, influencing market behavior around key levels.
13.Inflation swaps – A financial derivative that allows investors to hedge against inflation by exchanging fixed-rate payments for payments tied to an inflation index.
14.Ascending triangle – A bullish technical chart pattern formed by a rising lower trendline and a horizontal resistance level, indicating potential breakout momentum.
15.Stagflation – A challenging economic condition characterized by slow economic growth, high inflation, and high unemployment.
PHOTO CREDIT: https://www.shutterstock.com/g/g0d4ather
VIA SHUTTERSTOCK
DISCLOSURES
This report contains independent commentary to be used for informational and educational purposes only. Michael Kramer is a member and investment adviser representative with Mott Capital Management. Mr. Kramer is not affiliated with this company and does not serve on the board of any related company that issued this stock. All opinions and analyses presented by Michael Kramer in this analysis or market report are solely Michael Kramer’s views. Readers should not treat any opinion, viewpoint, or prediction expressed by Michael Kramer as a specific solicitation or recommendation to buy or sell a particular security or follow a particular strategy. Michael Kramer’s analyses are based upon information and independent research that he considers reliable, but neither Michael Kramer nor Mott Capital Management guarantees its completeness or accuracy, and it should not be relied upon as such. Michael Kramer is not under any obligation to update or correct any information presented in his analyses. Mr. Kramer’s statements, guidance, and opinions are subject to change without notice. Past performance is not indicative of future results. Neither Michael Kramer nor Mott Capital Management guarantees any specific outcome or profit. You should be aware of the real risk of loss in following any strategy or investment commentary presented in this analysis. Strategies or investments discussed may fluctuate in price or value. Investments or strategies mentioned in this analysis may not be suitable for you. This material does not consider your particular investment objectives, financial situation, or needs and is not intended as a recommendation appropriate for you. You must make an independent decision regarding investments or strategies in this analysis. Upon request, the advisor will provide a list of all recommendations made during the past twelve months. Before acting on information in this analysis, you should consider whether it is suitable for your circumstances and strongly consider seeking advice from your own financial or investment adviser to determine the suitability of any investment.


