

By: Gerry Sparrow
Stocks continued their slide through a volatile week. U.S. trade policy drove much of the market’s movement, broadening investors’ concerns about economic growth and inflation.
The Standard & Poor’s 500 Index declined 3.10 percent, while the Nasdaq Composite Index dropped 3.45 percent. The Dow Jones Industrial Average slid 2.37 percent. By contrast, the MSCI EAFE Index, which tracks developed overseas stock markets, rallied 2.85 percent.1,2
Tariffs Take Effect
Big price swings and tariff uncertainty loomed over the entire week. Stocks opened lower out of the gate after the White House confirmed the planned 25 percent tariff on Mexican and Canadian goods would go forward. Soft manufacturing and construction data also put broad downward pressure on markets. Meanwhile, European stocks continued to rally on anticipated defense spending.3
Stocks fell further as tariffs affected Canada, Mexico, and China. Each country announced retaliatory tariffs of their own, further fanning inflationary fears among investors. By Tuesday’s close, all three averages were down 3 percent on the week, and the S&P had given up its post-election gains.4
Markets rebounded midweek after the White House announced a one-month reprieve from tariffs for North American automakers complying with the existing United States-Mexico-Canada Agreement (USMCA). The recovery rally built momentum as the administration hinted that exemptions for other sectors could follow.5
However, as trade policy fatigue rose again, the rebound reversed—despite the White House pausing more tariffs on Canadian and Mexican imports until April 2. Comments from the Treasury secretary defending U.S. tariffs and downbeat economic reports put further pressure on share prices. The Nasdaq entered correction territory, and for the first time in five years, the S&P 500 hit its sixth consecutive day of +/-1 percent price swings.6Stocks continued to fall after an underwhelming February jobs report. Later, markets rebounded after Federal Reserve Chair Jerome Powell said that the economy “continues to be in a good place” and that the Fed was holding firm on current rates. The S&P, Dow, and Nasdaq all finished Friday in the green despite being down for the week.7
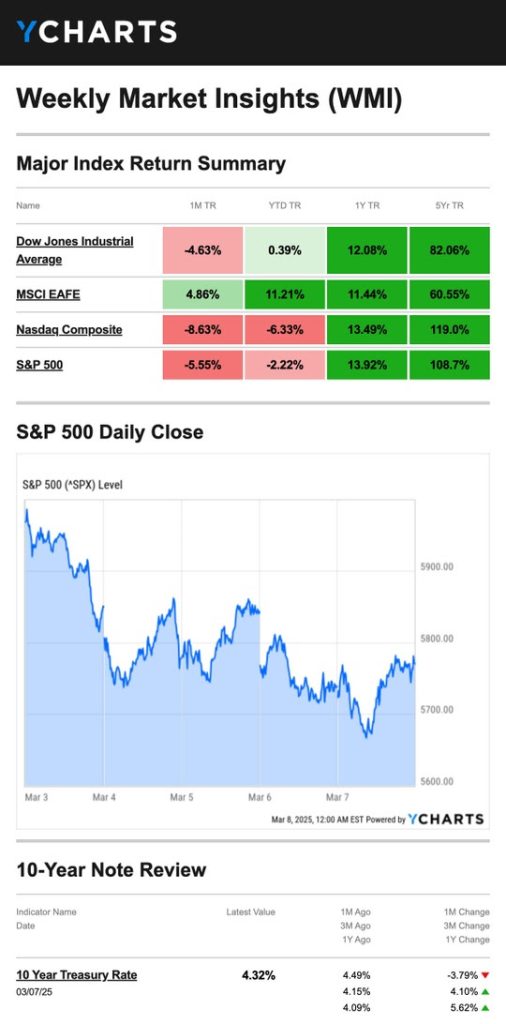
Source: YCharts.com, March 8, 2025. Weekly performance is measured from Monday, March 3, to Friday, March 7. TR = total return for the index, which includes any dividends as well as any other cash distributions during the period. Treasury note yield is expressed in basis points.
Under the Hood
The Institute for Supply Management (ISM) published fresh manufacturing data on Monday. Although headline numbers were decent, a closer look revealed that new orders dropped in January from a years-long high into correction territory while deliveries and prices paid jumped.8
This Week: Key Economic Data
Tuesday: Job Openings. NFIB Small Business Optimism Index.
Wednesday: Consumer Price Index (CPI). Federal Budget. Treasury Announcement.
Thursday: Producer Price Index (PPI). Initial Jobless Claims.
Friday: Consumer Sentiment.
Source: Investors Business Daily – Econoday economic calendar; March 7, 2025
The Econoday economic calendar lists upcoming U.S. economic data releases (including key economic indicators), Federal Reserve policy meetings, and speaking engagements of Federal Reserve officials. The content is developed from sources believed to be providing accurate information. The forecasts or forward-looking statements are based on assumptions and may not materialize. The forecasts also are subject to revision.
Originally posted on March 11, 2025
PHOTO CREDIT: https://www.shutterstock.com/g/MegaPixel8
VIA SHUTTERSTOCK
Footnotes and Sources
1. The Wall Street Journal, March 7, 2025
2. Investing.com, March 7, 2025
3. The Wall Street Journal, March 3, 2025
4. CNBC.com, March 4, 2025
5. CNBC.com, March 5, 2025
6. CNBC.com, March 6, 2025
7. MarketWatch.com, March 7, 2025
8. The Wall Street Journal, March 4, 2025
DISCLOSURES
Investing involves risks, and investment decisions should be based on your own goals, time horizon, and tolerance for risk. The return and principal value of investments will fluctuate as market conditions change. When sold, investments may be worth more or less than their original cost.
The forecasts or forward-looking statements are based on assumptions, may not materialize, and are subject to revision without notice.
The market indexes discussed are unmanaged, and generally, considered representative of their respective markets. Index performance is not indicative of the past performance of a particular investment. Indexes do not incur management fees, costs, and expenses. Individuals cannot directly invest in unmanaged indexes. Past performance does not guarantee future results.
The Dow Jones Industrial Average is an unmanaged index that is generally considered representative of large-capitalization companies on the U.S. stock market. Nasdaq Composite is an index of the common stocks and similar securities listed on the NASDAQ stock market and is considered a broad indicator of the performance of technology and growth companies. The MSCI EAFE Index was created by Morgan Stanley Capital International (MSCI) and serves as a benchmark of the performance of major international equity markets, as represented by 21 major MSCI indexes from Europe, Australia, and Southeast Asia. The S&P 500 Composite Index is an unmanaged group of securities that are considered to be representative of the stock market in general.
U.S. Treasury Notes are guaranteed by the federal government as to the timely payment of principal and interest. However, if you sell a Treasury Note prior to maturity, it may be worth more or less than the original price paid. Fixed income investments are subject to various risks including changes in interest rates, credit quality, inflation risk, market valuations, prepayments, corporate events, tax ramifications and other factors.
International investments carry additional risks, which include differences in financial reporting standards, currency exchange rates, political risks unique to a specific country, foreign taxes and regulations, and the potential for illiquid markets. These factors may result in greater share price volatility.
Please consult your financial professional for additional information.
This content is developed from sources believed to be providing accurate information. The information in this material is not intended as tax or legal advice. Please consult legal or tax professionals for specific information regarding your individual situation. This material was developed and produced by FMG Suite to provide information on a topic that may be of interest. FMG is not affiliated with the named representative, financial professional, Registered Investment Advisor, Broker-Dealer, nor state- or SEC-registered investment advisory firm. The opinions expressed and material provided are for general information, and they should not be considered a solicitation for the purchase or sale of any security.
Important Risk Information
Investing involves risk. Principal loss is possible.
If the adviser’s perceptions of a company’s growth potential are wrong, the securities purchased may not perform as expected, reducing the Fund’s return. Investments in small and midcap companies generally have greater risk and volatility. Diversification does not assure a profit or protect against a loss in a declining market. The fund’s investment objectives, risks, charges and expenses must be considered carefully before investing. The prospectus contains this and other important information about the investment company, and it may be obtained by calling 888-727-3301 or visiting www.sparrowcapital.com. Read it carefully before investing.


