

By: Matthew J. Bartolini, Head of SPDR Americas Research
The 60/40 portfolio is off to a good start, as bonds posted gains and global stocks rallied 7.1% in January. As a result, ETFs had $40 billion of inflows, nearly double January’s historical average. Flows were led by the $21 billion into non-US equities (ninth-best ever); US equities had outflows. Meanwhile, bond ETFs added $20 billion of inflows, led by the $7 billion into investment-grade (IG) corporates (third-best ever).
If goldfish have short memories and elephants have long ones, investors need to be part goldfish and part elephant. The goldfish portion helps avoid recency bias and anchoring to the most recent trend or “hot-dot.” It also helps with not fixating on a few days of negative returns. It’s the same concept I relay to my third grade soccer team after the opposing team scores — shake it off and get back in the game (thanks, Ted Lasso).
The elephant side allows investors to stick to their long-term plan by recalling fundamental portfolio construction beliefs. This ranges from rebalancing programs that prevent knee jerk market timing reactions to strategic asset allocation frameworks that let diversification do the heavy lifting during times of market stress.
Balancing goldfish and elephant cognitive thought processes is the trick. Too much goldfish, and investors miss red flags or are unaware that a new trend could have staying power. Goldfish-only investors likely missed how consistent aggressive rate hikes impacted both stocks and bonds last year — and didn’t move fast enough to alter their allocations. Too much elephant, and investors don’t budge off their first principles and become inflexible. For example, they mistakenly believe that they can always rely on a Federal Reserve (Fed) Put.
But investors have kicked off 2023 as goldfish, forgetting the poor returns across asset classes in 2022 and the Fed’s resolve to keep hiking rates to tame inflation. As a result, January inflows were well above their average.
Investors Head Overseas
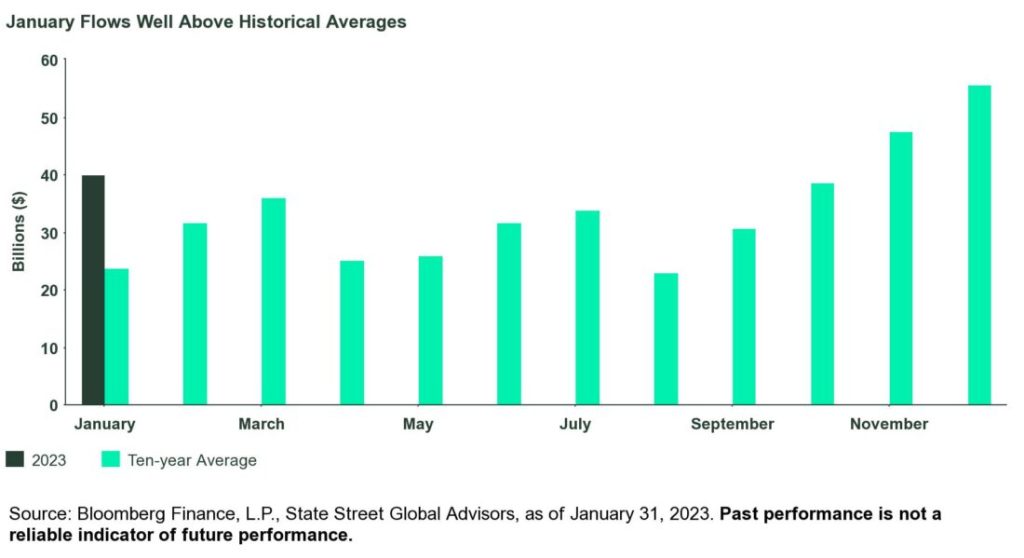
As a result of seasonal effects largely stemming from tax-motivated behavior in equity exposures, January is typically a subdued month for flows. In fact, the 10-year average for January inflows is just $23 billion, the lowest total of any month.
Driven by gains in both stocks and bonds following a dour 2022, where both asset classes fell double digits, January flows got off to a better-than-average start — taking in $40 billion, almost double the monthly average, as shown below.
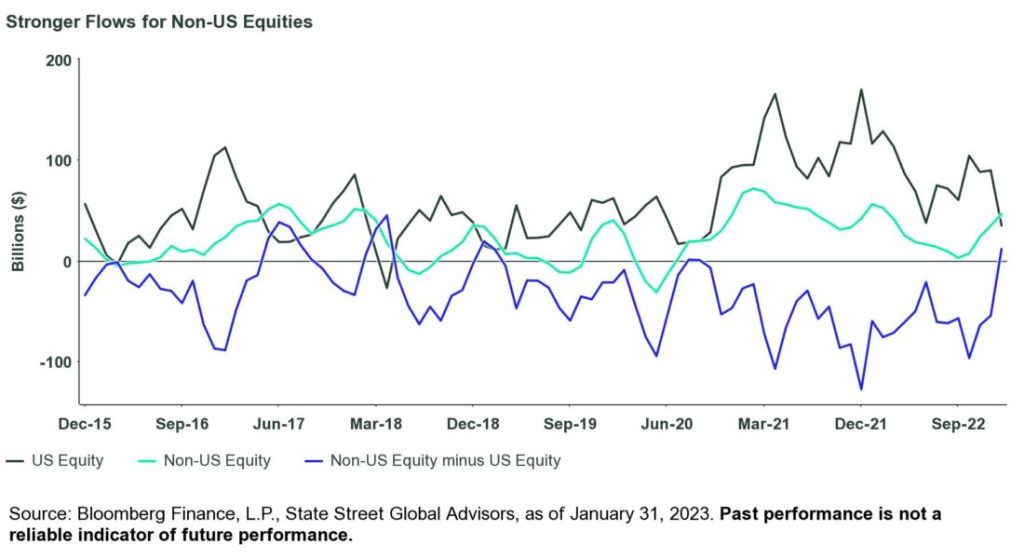
The above average flows were driven by heightened interest in non-US equities, and for good reason. Relative to US equities, non-US stocks are on their best three-month run since the Global Financial Crisis. In fact, their 13% outperformance over the past three months ranks in the 99th percentile over 20 years.1
A weakening US dollar, fewer downside earnings revisions, China’s re-opening, and more attractive valuations are driving this performance trend. This is investors activating their elephant synapses to recall how liquidity, attractive fundamentals, and macro tailwinds support performance.
Accordingly, international regional ETFs had $5 billion of inflows in January, their most all-time for a month. Regional funds led the non-US equity category with $21 billion of inflows, their ninth-best month ever.
Single-country funds (led by China’s $2 billion of inflows, the fourth-best month ever as investors are finally waking up to a potential rebound) had their fifth-best month ever (+$4 billion). And emerging market (EM) funds added another $5 billion, ranking in the historical 97th percentile.
All this occurred as US-focused exposures posted outflows for the first time since April 2022. As a result, the short-term trend has begun to favor non-US exposures, as shown below. On a trailing three-month basis, non-US is now outpacing the US for the first time since 2019 in a material way. But despite the strong recent trend, flows over the past year for non-US exposures remain almost $200 billion below that of US equities — indicating the non-US trade is not yet crowded.
Click here to read the full article
Footnotes
1 Bloomberg Finance, L.P. as of January 31, 2023 based on the performance of the S&P 500 Index and the MSCI World ex-US Index.
2 Bloomberg Finance, L.P as of January 31, 2023 based on the US Dollar Spot Rate.
3 FactSet as of January 31, 2023.
4 FactSet as of January 31, 2023.
5 FactSet as of January 31, 2023.
Glossary
Bloomberg Commodity Index (BCOM)
Calculated on an excess return basis and reflects commodity futures price movements.
Bloomberg US Aggregate Index
Flagship measure of US investment grade debt from a multitude of local currency markets. This benchmark includes treasury, government-related, corporate and securitized fixed-rate bonds.
MSCI ACWI Index
Market-capitalization-weighted stock market index that measures the stock performance of the companies in developed and emerging markets.
MSCI World Ex-US Index
Market-capitalization-weighted stock market index that measures the stock performance of the companies in developed markets – excluding the US.
S&P 500® Index
Market-capitalization-weighted stock market index that measures the stock performance of the 500 largest publicly traded companies in the United States.
Smart Beta
Term for rules-based investment strategies that don’t use conventional market-cap weightings.
—
Originally Posted February 6, 2023 – Investors Put 2022 in the Rearview and Double January’s Average ETF Inflow
PHOTO CREDIT: https://www.shutterstock.com/g/g-stockstudio
Via SHUTTERSTOCK
Disclosure
The views expressed in this material are the views of the SPDR Research and Strategy team and are subject to change based on market and other conditions. It should not be considered a solicitation to buy or an offer to sell any security. It does not take into account any investor’s particular investment objectives, strategies, tax status or investment horizon. There is no representation or warranty as to the current accuracy of such information, nor liability for decisions based on such information. Past performance is not a reliable indicator of future performance.
Unless otherwise noted, all data and statistical information were obtained from Bloomberg LP and SSGA as of January 31, 2023. Data in tables have been rounded to whole numbers, except for percentages, which have been rounded to the nearest tenth of a percent.
The research and analysis included in this document have been produced by SSGA for its own investment management activities and are made available here incidentally. Information obtained from external sources is believed to be reliable and is as of the date of publication but is subject to change. This information must not be used in any jurisdiction where prohibited by law and must not be used in a way that would be contrary to local law or legislation. No investment advice, tax advice, or legal advice is provided herein.
Investing involves risk including the risk of loss of principal.
Bonds generally present less short-term risk and volatility than stocks, but contain interest rate risk (as interest rates raise, bond prices usually fall); issuer default risk; issuer credit risk; liquidity risk; and inflation risk. These effects are usually pronounced for longer-term securities. Any fixed income security sold or redeemed prior to maturity may be subject to a substantial gain or loss.
Equity securities may fluctuate in value in response to the activities of individual companies and general market and economic conditions.
Concentrated investments in a particular sector or industry tend to be more volatile than the overall market and increases risk that events negatively affecting such sectors or industries could reduce returns, potentially causing the value of the Fund’s shares to decrease.
The whole or any part of this work may not be reproduced, copied or transmitted or any of its contents disclosed to third parties without SSGA’s express written consent.


