

By: Olivia Engel, CFA, CIO, Active Quantitative Equity
The Active Quantitative Equity (AQE) team uses a wide range of metrics to form a multi-dimensional view of stocks, based on our main themes of Value, Quality, and Sentiment. Within the Sentiment theme, directly captured data (price action) as well as indirectly captured data (throughout the supply chain) give us a highly granular way in which to assess overall investor sentiment. These measures complement the other ways in which we view Sentiment – i.e., earnings sentiment as well as sentiment captured through dialogue with company management1 or through hedge fund positioning. We have higher confidence in our stock selections when these sentiment measures align.
Segment implications
The AQE team believes that we can build a richer picture of investor sentiment by taking advantage of the time it takes for sentiment to trickle through the supply chain. Therefore, we use supply chain linkages to map the network of suppliers to customers and, in so doing, build metrics that look deeper into investor sentiment. We believe that sentiment is best assessed when examined from as many angles as possible.
For that reason, we look at indirect measures that use the supply chain to gauge the sentiment toward a company’s customers (which we call “customer sentiment”), in addition to direct measures of sentiment based on stock-price movements (here referred to as “share price momentum”). Customer sentiment presents an opportunity to take advantage of the time it takes for investors to process information about the flow from customers to suppliers before investors at-large process the complexities of the supply chain.
In some segments the AQE team is seeing a disconnect between direct measures of investor sentiment using price movements of company stock prices (“share price momentum”) and indirect measures that use the supply chain to gauge the sentiment toward a company’s customers (“customer sentiment”). The fact that this disconnect can happen from time to time is exactly the reason why it is important to evaluate from multiple dimensions. No one angle represents a “better truth,” so by incorporating multiple angles, scoring will be diluted when the disagreement exists, and scoring will be amplified when the measures are aligned, thereby giving us more confidence in the overall assessment of the stock.
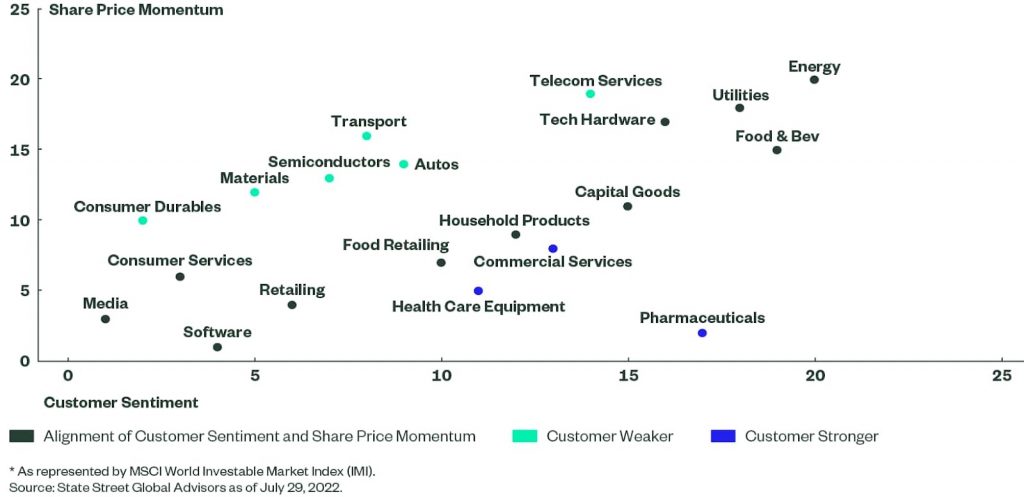
The segments where we see customer sentiment meaningfully weaker than share price momentum are Telecommunications Services, Semiconductors, Materials, Autos, Transport, and Consumer Durables (see Figure 1).
In Consumer Durables and Telecommunications Services, while there remains a difference in the two measures, share price momentum and customer sentiment have started to converge in the last few months, a pattern which builds confidence that our multi-dimensional sentiment measure is helping us forecast stock prices more successfully. In the case of Consumer Durables, our overall measures of investor sentiment are weak, while in Telecommunications Services they are strong and improving relative to other segments.
In the Materials, Semiconductors, and Transport segments, the differences between customer sentiment and share price momentum have widened as customer sentiment has further deteriorated.
Within the Materials segment, we see the disconnect across gold, paper, chemicals, metals, and other sub sectors across the world. Within Transport, shipping and other cargo companies are seeing the greatest disconnect and weakening of customer sentiment. Within Semiconductors, Japanese companies are experiencing more disconnect in share price momentum versus customer sentiment.
There are many possible explanations for disconnects between price momentum and customer sentiment. A closer look at a specific sector example sheds further light on this topic. For the Semiconductor segment, for instance, supply chain shortages, a recurring theme, are likely driving the disconnect between more positive sentiment for semiconductor manufacturers and more negative sentiment for their customers. The demand for semiconductor chips is notably higher than supply right now. Goods like cars or data centers cannot be finished without the chips. Many years ago such a supply shortage would only have impacted the production of personal computers. In contrast, in today’s economy, the usage of semiconductor chips is far more widespread across sectors. While customer companies are currently challenged and at times unable to complete production of their goods, suppliers are mostly at over capacity. Many of the chipmakers’ open orders are many times higher than production capacity levels. This implies the impact of a recession on customer demand would have to be very deep and long to put a dent in the expected revenue observed in some of these semiconductor companies.
Relying on metrics, in this case a dataset that can map these supply chain complexities, is beneficial and enables us to calculate a measure of sentiment objectively and to make a determination by means of algorithms as opposed to more subjective means.
Figure 1: Share Price Momentum and Customer Sentiment Across Developed Market* Sectors
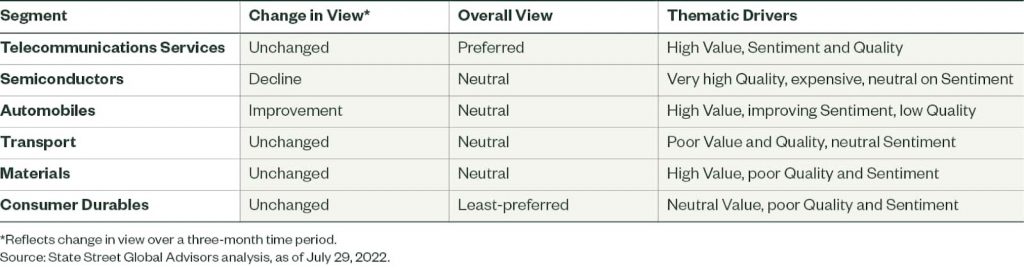
Sentiment measures shift more rapidly than Value and Quality measures, and over the last few months, while the different measures of Sentiment have changed, the AQE team’s overall preferences for the segments discussed here have not changed dramatically, primarily because when Sentiment improves, stocks become more expensive, and vice versa. The changes can offset each other. Figure 2 summarizes our current view on the segments discussed, how they have changed, and the underlying themes shaping that view.
Figure 2: Summary of AQE Views in Segments Where Customer Sentiment Is Weaker than Share Price Momentum
The Bottom Line
In today’s market of high uncertainty about recession risk and inflation pressure on corporate earnings, investor sentiment provides an additional input to assess potential equity performance. By examining both direct and indirect measures of investor sentiment, the AQE team can develop a multi-dimensional outlook on companies and a more comprehensive way in which to analyze overall sentiment. This approach to measuring investor sentiment serves as an informational edge which helps us to project potential winners.
This post first appeared on August 16th 2022, SSGA Blog
PHOTO CREDIT: https://www.shutterstock.com/g/PKpix
Footnote
1 E.g., conference calls, analyzed using natural language processing techniques.
Disclosure
ssga.com
Marketing Communication
State Street Global Advisors Worldwide Entities
For use in EMEA: The information contained in this communication is not a research recommendation or ‘investment research’ and is classified as a ‘Marketing Communication’ in accordance with the Markets in Financial Instruments Directive (2014/65/EU) or applicable Swiss regulation. This means that this marketing communication (a) has not been prepared in accordance with legal requirements designed to promote the independence of investment research (b) is not subject to any prohibition on dealing ahead of the dissemination of investment research.
This communication is directed at professional clients (this includes eligible counterparties as defined by the appropriate EU regulator) who are deemed both knowledgeable and experienced in matters relating to investments. The products and services to which this communication relates are only available to such persons, and persons of any other description (including retail clients) should not rely on this communication.
Important Risk Information
The information provided does not constitute investment advice and it should not be relied on as such. It should not be considered solicitation to buy or an offer to sell a security. It does not take into account any investor’s particular investment objectives, strategies, tax status or investment horizon. You should consult your tax and financial advisor.
All information is from SSGA unless otherwise noted and has been obtained from sources believed to be reliable, but its accuracy is not guaranteed. There is no representation or warranty as to the current accuracy, reliability or completeness of, nor liability for, decisions based on such information and it should not be relied on as such.
This document contains certain statements that may be deemed forward-looking statements. Please note that any such statements are not guarantees of any future performance and actual results or developments may differ materially from those projected. Investing involves risk including the risk of loss of principal.
The views expressed are the views of Active Quantitative Equity through August 11, 2022, and are subject to change based on market and other conditions.
Quantitative investing assumes that future performance of a security relative to other securities may be predicted based on historical economic and financial factors, however, any errors in a model used might not be detected until the fund has sustained a loss or reduced performance related to such errors.
Equity securities may fluctuate in value and can decline significantly in response to the activities of individual companies and general market and economic conditions.
© 2022 State Street Corporation.


