

By: Mark Barnes, PhD, and Christine Haggerty, Global Investment Research (Americas), FTSE Russell
Global stock markets have been hit hard this year, but few as severely as the US. With its outsized exposure to the world’s largest technology companies, the US has taken the brunt of the crushing selloff in high-growth stocks amid the investor flight from pricier, riskier segments of the market.
The broad US market, represented below by the FTSE USA index, fell 9% in April, marking one of its worst monthly performances of the past decade and nearly four times the percentage loss of the FTSE All-World ex US index for the month. The US now ranks at the bottom of the global performance scoreboard for the year so far.
FTSE index returns – 1M and YTD through April 30, 2022 (TR, LC)
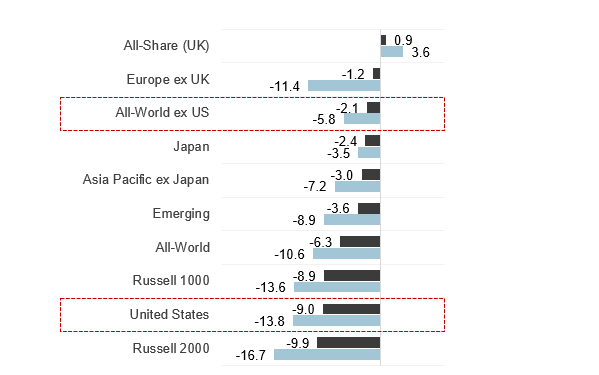
Source: FTSE Russell. Data as of April 30, 2022. Past performance is no guarantee to future results. Please see the end for important disclosures.
The US losing streak has come amid a global rate-hiking cycle, the Russia-Ukraine war and the slowdown in China growth, which have stoked global recession fears and extreme market volatility. This backdrop, and the resulting spike in interest rates, has proved particularly lethal for long-popular technology and consumer discretionary stocks , which together make up 43% of the US index vs 14% for the rest of the world. Globally, these two stocks groups plunged 11.7% and 9.9%, respectively, in April, and were down 21.2% and 18.5% for the first four months.
The US market’s smaller exposure to last month’s top performers – i.e., consumer staples (the only group to post a gain across markets) and energy (essentially flat globally) – also hurt.
Russell 1000 holds its edge in April
The pain encompassed both large and small US stocks, with the Russell 1000 and Russell 2000 posting percentage declines in the mid-teens YTD. However, as the time-series chart below illustrates, the downdraft has been far steeper for the small-cap index than its large-cap counterpart. While the Russell 1000 is down 2.1% for the 12-month period, it has notched a nearly 15-percentage-point lead on the Russell 2000 for that longer time span.
Russell 1000 vs Russell 2000 Index returns (TR, rebased)
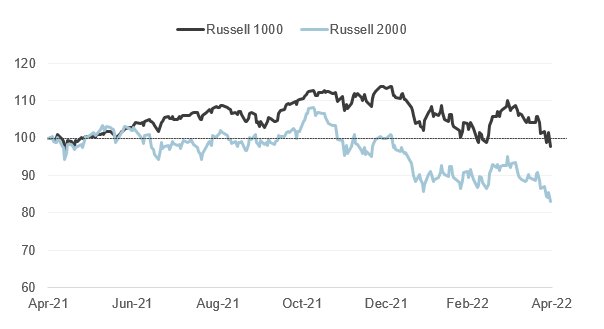
Source: FTSE Russell. Data as of April 30, 2022. Past performance is no guarantee of future results. Please see the end for important legal disclosures.
Bias to large-caps remains in play
As has been the case for most of this year, investors continued to show a clear preference for the largest players within the best-performing industries in April, notably those benefiting from soaring commodity prices (energy and basic materials stocks) and less cyclically sensitive, stable-growth companies (consumer staples, telecom and utilities). Notably, the Russell 1000 also outperformed the small-cap index in industries that suffered the biggest declines in April, most notably in technology, consumer discretionary and industrials.
One-month industry returns (TR, %) – April 2022
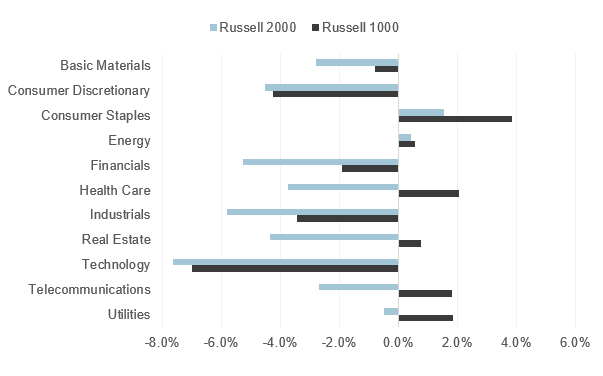
Source: FTSE Russell. Based on Industry Classification Benchmark (ICB) data as of April 30, 2022. Past performance is no guarantee of future results. Please see the end for important legal disclosures.
Diving into YTD sector-weighted returns, we find that outperforming sectors within consumer staples (e.g., tobacco and beverages), basic materials (e.g., industrial metals & mining) – as well as smaller losses in financials (i.e., banks) – were the main sources of the Russell 1000 leadership versus the Russell 2000 for the year so far.
Smaller gains in oil & gas and bigger losses in technology software and hardware were far from the biggest drags on Russell 1000 relative returns YTD.
Top/bottom 10 contributors to returns (TR, %) – YTD through April 30, 2022
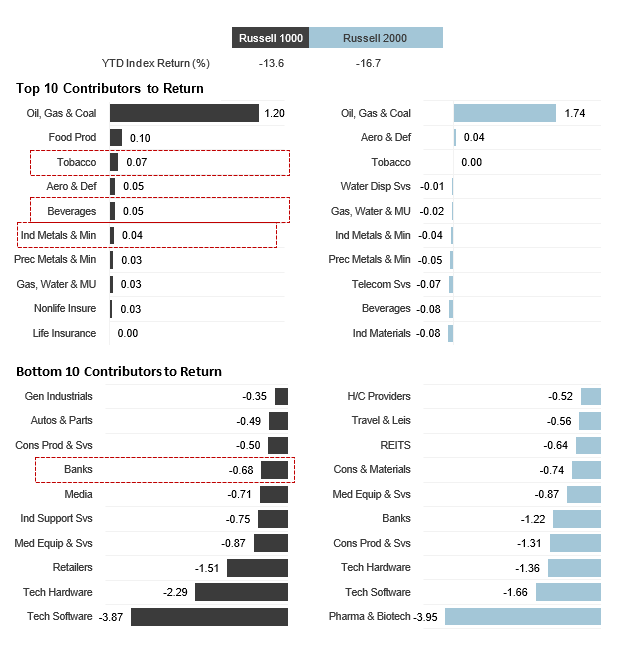
Source: FTSE Russell. Based on Industry Classification Benchmark (ICB) data as of April 30, 2022. Past performance is no guarantee of future results. Please see the end for important legal disclosures.
Subscribe to our blog.
© 2022 London Stock Exchange Group plc and its applicable group undertakings (the “LSE Group”). The LSE Group includes (1) FTSE International Limited (“FTSE”), (2) Frank Russell Company (“Russell”), (3) FTSE Global Debt Capital Markets Inc. and FTSE Global Debt Capital Markets Limited (together, “FTSE Canada”), (4) FTSE Fixed Income Europe Limited (“FTSE FI Europe”), (5) FTSE Fixed Income LLC (“FTSE FI”), (6) The Yield Book Inc (“YB”) and (7) Beyond Ratings S.A.S. (“BR”). All rights reserved.
FTSE Russell® is a trading name of FTSE, Russell, FTSE Canada, FTSE FI, FTSE FI Europe, YB and BR. “FTSE®”, “Russell®”, “FTSE Russell®”, “FTSE4Good®”, “ICB®”, “The Yield Book®”, “Beyond Ratings®” and all other trademarks and service marks used herein (whether registered or unregistered) are trademarks and/or service marks owned or licensed by the applicable member of the LSE Group or their respective licensors and are owned, or used under license, by FTSE, Russell, FTSE Canada, FTSE FI, FTSE FI Europe, YB or BR. FTSE International Limited is authorized and regulated by the Financial Conduct Authority as a benchmark administrator.
All information is provided for information purposes only. All information and data contained in this publication is obtained by the LSE Group, from sources believed by it to be accurate and reliable. Because of the possibility of human and mechanical error as well as other factors, however, such information and data is provided “as is” without warranty of any kind. No member of the LSE Group nor their respective directors, officers, employees, partners or licensors make any claim, prediction, warranty or representation whatsoever, expressly or impliedly, either as to the accuracy, timeliness, completeness, merchantability of any information or of results to be obtained from the use of FTSE Russell products, including but not limited to indexes, data and analytics, or the fitness or suitability of the FTSE Russell products for any particular purpose to which they might be put. Any representation of historical data accessible through FTSE Russell products is provided for information purposes only and is not a reliable indicator of future performance.
No responsibility or liability can be accepted by any member of the LSE Group nor their respective directors, officers, employees, partners or licensors for (a) any loss or damage in whole or in part caused by, resulting from, or relating to any error (negligent or otherwise) or other circumstance involved in procuring, collecting, compiling, interpreting, analyzing, editing, transcribing, transmitting, communicating or delivering any such information or data or from use of this document or links to this document or (b) any direct, indirect, special, consequential or incidental damages whatsoever, even if any member of the LSE Group is advised in advance of the possibility of such damages, resulting from the use of, or inability to use, such information.
No member of the LSE Group nor their respective directors, officers, employees, partners or licensors provide investment advice and nothing in this document should be taken as constituting financial or investment advice. No member of the LSE Group nor their respective directors, officers, employees, partners or licensors make any representation regarding the advisability of investing in any asset or whether such investment creates any legal or compliance risks for the investor. A decision to invest in any such asset should not be made in reliance on any information herein. Indexes cannot be invested in directly. Inclusion of an asset in an index is not a recommendation to buy, sell or hold that asset nor confirmation that any particular investor may lawfully buy, sell or hold the asset or an index containing the asset. The general information contained in this publication should not be acted upon without obtaining specific legal, tax, and investment advice from a licensed professional.
Past performance is no guarantee of future results. Charts and graphs are provided for illustrative purposes only. Index returns shown may not represent the results of the actual trading of investable assets. Certain returns shown may reflect back-tested performance. All performance presented prior to the index inception date is back-tested performance. Back-tested performance is not actual performance, but is hypothetical. The back-test calculations are based on the same methodology that was in effect when the index was officially launched. However, back-tested data may reflect the application of the index methodology with the benefit of hindsight, and the historic calculations of an index may change from month to month based on revisions to the underlying economic data used in the calculation of the index.
This document may contain forward-looking assessments. These are based upon a number of assumptions concerning future conditions that ultimately may prove to be inaccurate. Such forward-looking assessments are subject to risks and uncertainties and may be affected by various factors that may cause actual results to differ materially. No member of the LSE Group nor their licensors assume any duty to and do not undertake to update forward-looking assessments.
No part of this information may be reproduced, stored in a retrieval system or transmitted in any form or by any means, electronic, mechanical, photocopying, recording or otherwise, without prior written permission of the applicable member of the LSE Group. Use and distribution of the LSE Group data requires a license from FTSE, Russell, FTSE Canada, FTSE FI, FTSE FI Europe, YB, BR and/or their respective licensors.
This post first appeared on May 10th, 2022 on the FTSE Russell Blog
PHOTO CREDIT: https://www.shutterstock.com/g/diy13
Via SHUTTERSTOCK
DISCLOSURE
Investing involves risk, including the possible loss of principal. Diversification does not ensure a profit nor guarantee against a loss.
This material represents an assessment of the market environment at a specific point in time and is not intended to be a forecast of future events, or a guarantee of future results. This information is not intended to be individual or personalized investment or tax advice and should not be used for trading purposes. Please consult a financial advisor or tax professional for more information regarding your investment and/or tax situation.
Certain of the information contained in this article is based upon forward-looking statements, information and opinions, including descriptions of anticipated market changes and expectations of future activity. The authors believe that such statements, information, and opinions are based upon reasonable estimates and assumptions. However, forward-looking statements, information and opinions are inherently uncertain and actual events or results may differ materially from those reflected in the forward-looking statements. Therefore, undue reliance should not be placed on such forward-looking statements, information and opinions.
The FTSE USA Index is a market-capitalization weighted index representing the performance of US large and mid cap stocks. FTSE All-World ex US index comprises Large and Mid cap stocks providing coverage of Developed and Emerging Markets excluding the US. Russell 1000 is a subset of the larger Russell 3000 Index and represents the 1000 top companies by market capitalization in the United States. The Russell 2000 Index is a small-cap stock market index that makes up the smallest 2,000 stocks in the Russell 3000 Index. Indexes cannot be invested in directly.


