

By Philip Lawlor, managing director, Global Markets Research
With global equity benchmarks in bear-market territory, valuations haven’t been this low in years. But given the still-opaque outlook for world economies and earnings, the caveat of “let the buyer beware” remains an apt warning.
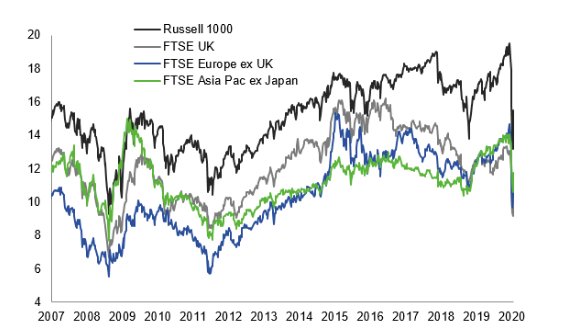
Based on 12-month forward EPS forecasts, PE multiples have fallen precipitously across developed markets, wiping out all or more of their gains since December 2018—and at, or approaching, multiyear lows. Notably, the Russell 1000 multiple (at 15.5×) remains well above those of its developed peers, particularly versus the UK, where it sits at 10.2×, in line with levels last seen in 2012.
Even so, forward PEs have yet to plumb the lows touched during the 2008-09 crash or the 2011-12 European sovereign debt crisis.
Regional 12-month-forward price/earnings ratios – round trip to multiyear lows
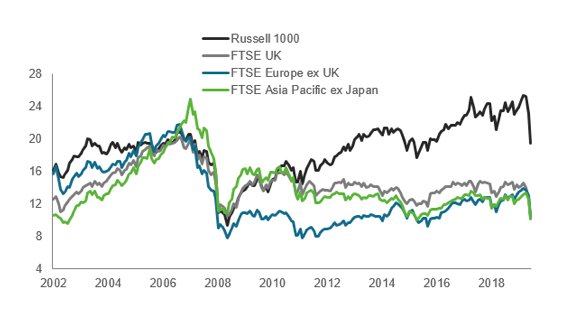
Cyclically adjusted PEs (CAPEs), based on an average of earnings over rolling 10-year periods to smooth out economic fluctuations, tell a similar story—they have plunged across markets this year. However, the Russell 1000 multiple remains well above those of its developed-market peers, which have converged close to their 2008 crisis levels.
Cyclically adjusted moving-average PE (CAPE) ratios – all but US back near crisis lows
Source: FTSE Russell / Refinitiv. Data through March 31, 2020. Past performance is no guarantee of future results. Please see the end for important legal disclosures.
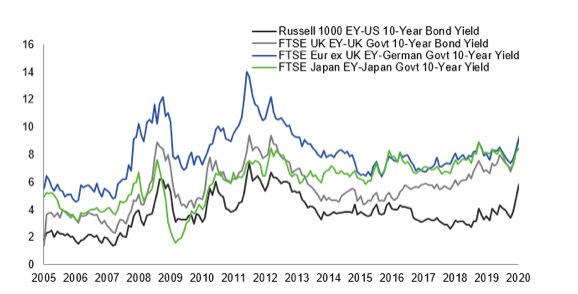
The Fed Valuation Model chart below compares equity earnings yields (the inversion of the PE) with their respective 10-year sovereign bond yields. The spread between the two (or the equity risk premium) is more than eight percentage points in Europe, the UK and Japan—at or near 15-year highs for the latter two. Despite the significant uptick, the US equity risk premium, at nearly six percentage points, remains well below its crisis highs and significantly below those of its developed peers.
Equity earnings yield minus 10-year sovereign bond yield—equity risk premiums at multi-year highs.
As we wrote in an earlier blog post, the next big test for markets will likely be the cascade of profit warnings and negative EPS revisions ahead, as investors gain greater clarity about the extent of the pandemic’s impact on economies and earnings. The market response will be a useful gauge of what has already been discounted.
Source: FTSE Russell / Refinitiv. Data through March 31, 2020. Past performance is no guarantee of future results. Please see the end for important legal disclosures.
Photo Credit: Zooey via Flickr Creative Commons
© 2020 London Stock Exchange Group plc and its applicable group undertakings (the “LSE Group”). The LSE Group includes (1) FTSE International Limited (“FTSE”), (2) Frank Russell Company (“Russell”), (3) FTSE Global Debt Capital Markets Inc. and FTSE Global Debt Capital Markets Limited (together, “FTSE Canada”), (4) MTSNext Limited (“MTSNext”), (5) Mergent, Inc. (“Mergent”), (6) FTSE Fixed Income LLC (“FTSE FI”), (7) The Yield Book Inc (“YB”) and (8) Beyond Ratings S.A.S. (“BR”). All rights reserved.
FTSE Russell® is a trading name of FTSE, Russell, FTSE Canada, MTSNext, Mergent, FTSE FI, YB and BR. “FTSE®”, “Russell®”, “FTSE Russell®”, “MTS®”, “FTSE4Good®”, “ICB®”, “Mergent®”, “The Yield Book®”, “Beyond Ratings®” and all other trademarks and service marks used herein (whether registered or unregistered) are trademarks and/or service marks owned or licensed by the applicable member of the LSE Group or their respective licensors and are owned, or used under licence, by FTSE, Russell, MTSNext, FTSE Canada, Mergent, FTSE FI, YB or BR. FTSE International Limited is authorised and regulated by the Financial Conduct Authority as a benchmark administrator.
All information is provided for information purposes only. All information and data contained in this publication is obtained by the LSE Group, from sources believed by it to be accurate and reliable. Because of the possibility of human and mechanical error as well as other factors, however, such information and data is provided “as is” without warranty of any kind. No member of the LSE Group nor their respective directors, officers, employees, partners or licensors make any claim, prediction, warranty or representation whatsoever, expressly or impliedly, either as to the accuracy, timeliness, completeness, merchantability of any information or of results to be obtained from the use of FTSE Russell products, including but not limited to indexes, data and analytics, or the fitness or suitability of the FTSE Russell products for any particular purpose to which they might be put. Any representation of historical data accessible through FTSE Russell products is provided for information purposes only and is not a reliable indicator of future performance.
No responsibility or liability can be accepted by any member of the LSE Group nor their respective directors, officers, employees, partners or licensors for (a) any loss or damage in whole or in part caused by, resulting from, or relating to any error (negligent or otherwise) or other circumstance involved in procuring, collecting, compiling, interpreting, analysing, editing, transcribing, transmitting, communicating or delivering any such information or data or from use of this document or links to this document or (b) any direct, indirect, special, consequential or incidental damages whatsoever, even if any member of the LSE Group is advised in advance of the possibility of such damages, resulting from the use of, or inability to use, such information.
No member of the LSE Group nor their respective directors, officers, employees, partners or licensors provide investment advice and nothing contained in this document or accessible through FTSE Russell Indexes, including statistical data and industry reports, should be taken as constituting financial or investment advice or a financial promotion.
Past performance is no guarantee of future results. Charts and graphs are provided for illustrative purposes only. Index returns shown may not represent the results of the actual trading of investable assets. Certain returns shown may reflect back-tested performance. All performance presented prior to the index inception date is back-tested performance. Back-tested performance is not actual performance, but is hypothetical. The back-test calculations are based on the same methodology that was in effect when the index was officially launched. However, back- tested data may reflect the application of the index methodology with the benefit of hindsight, and the historic calculations of an index may change from month to month based on revisions to the underlying economic data used in the calculation of the index.
This publication may contain forward-looking assessments. These are based upon a number of assumptions concerning future conditions that ultimately may prove to be inaccurate. Such forward-looking assessments are subject to risks and uncertainties and may be affected by various factors that may cause actual results to differ materially. No member of the LSE Group nor their licensors assume any duty to and do not undertake to update forward-looking assessments.
No part of this information may be reproduced, stored in a retrieval system or transmitted in any form or by any means, electronic, mechanical, photocopying, recording or otherwise, without prior written permission of the applicable member of the LSE Group. Use and distribution of the LSE Group data requires a licence from FTSE, Russell, FTSE Canada, MTSNext, Mergent, FTSE FI, YB and/or their respective licensors.


