

By: Jose Torres, Interactive Brokers’ Senior Economist
Markets are rallying with this morning’s weaker-than-expected economic data dampening concerns of a prolonged journey across the monetary policy bridge. Today’s retail sales and CPI figures point to April consumption contracting as dollar transactions were flat while prices rose materially. Overall, fears of a consumer slowdown are incrementally increasing, with households pressured by elevated prices, lofty interest rates and reduced credit availability. The stagflationary combination points to the first rate cut happening in September but odds of a July cut are rising as economic activity continues to surprise to the downside.
Cars Drive Moderation in CPI Increase
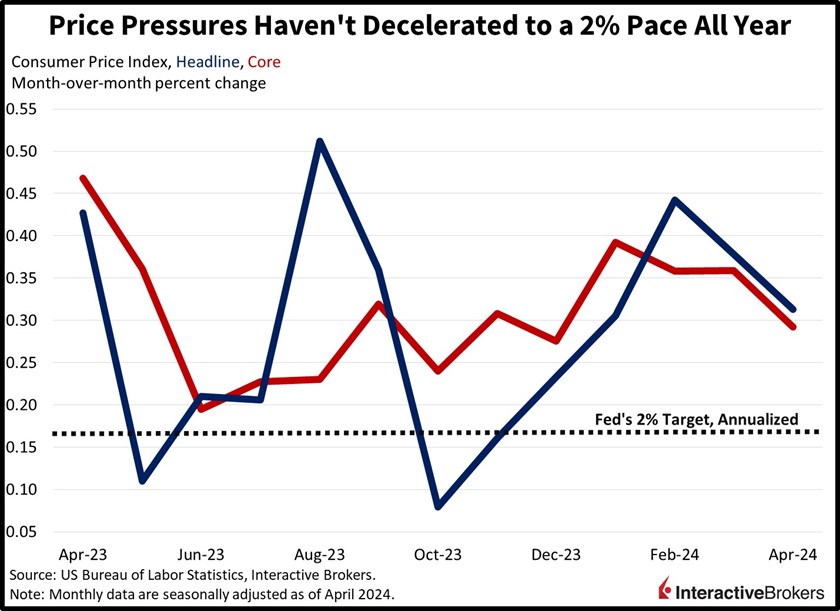
Consumer prices slowed last month thanks to a sizable drag from automobile prices. The April Consumer Price Index (CPI) increased 0.3% month over month (m/m) and 3.4% year over year (y/y), slower than the estimated 0.4%, which would have been unchanged from March. Similarly, core figures, which exclude food and energy, rose 0.3% m/m and 3.6% y/y, in-line with estimates and down from March’s 0.4% increase. While inflation is slowing, it remains a far cry from the Fed’s target of 2%, which is consistent with m/m increases of just 0.166%. So far, every inflation print for the first four months of this year has been significantly higher than that rate.
April Inflation Was Widespread
April inflation existed in most categories last month, while goods and commodities provided some relief. Leading the charge higher, however, were the gasoline, apparel, and transportation services segments, which saw charges rise 2.8%, 1.2% and 0.9% m/m. Increasing at more tempered degrees were the medical care commodities, shelter, medical care services and food at dining establishments with stickers up 0.4%, 0.4%, 0.4% and 0.3%. On the other hand, deflationary pressures were present in used automobiles, energy services (heating and electric), new automobiles and food at markets with prices declining 1.4%, 0.7%, 0.4% and 0.2%.
Consumers Hit the Brakes Hard
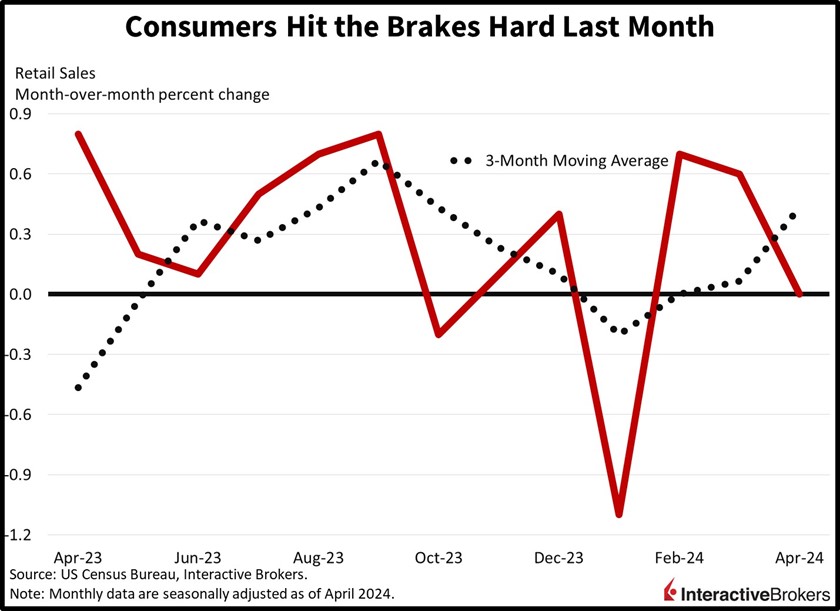
Even as overall inflation increased, it wasn’t propelled by demand, with retail sales decelerating to a full stop last month. Retail sales posted a doughnut, missed projections of 0.4% m/m and decelerated from a sharp gain of 0.6% in March. Transactions excluding automobiles did gain 0.2%, however, but when excluding automobiles and gasoline, sales declined 0.1% during the period. The control group, which serves as significant inputs to the consumption aspect of gross domestic product, declined 0.3% during the period.
Shopping categories were mixed last month in terms of consumer momentum, with seven out of thirteen components experiencing declines. The laggards were driven by ecommerce, sporting goods retailers, automobile dealerships, health stores and furniture showrooms with transactions declining 1.2%, 0.9%, 0.8%, 0.6% and 0.5% m/m. General merchandise shops and miscellaneous establishments also experienced contractions but of lesser magnitudes during the period: 0.4% and 0.3%. Offsetting the weakness were gasoline stations, clothing shops, electronics destinations, food markets, building materials suppliers, and restaurants/bars with sales rising 3.1%, 1.6%, 1.5%, 0.8%, 0.5% and 0.2%.
Apparel Retailers Struggle, But Fresh Food Sales Climb
Recent earnings reports continue to depict declines in consumer shopping, at least for clothing, but on a positive note, business spending for technology appears to be increasing. The following highlights illustrate these points:
- Luxury apparel company Burberry Group’s results for the fiscal year ended March 30 missed the company’s guidance with slowing demand for high-end products creating challenges. For the 12-month period, earnings declined but exceeded analysts’ forecasts. Revenue also fell but was roughly in-line with estimates. In the most recent quarter, comparable same store sales fell 12% y/y. Overall sales declined in all the company’s regions—Asia Pacific, EMEIA and the Americas. The company anticipates that the first half of its current fiscal year will be difficult, but it believes the second half will be strong as Burberry’s efforts to strengthen its brand and reduce costs to offset the impact of inflation kick in.
- Boot Barn, a provider of Western-styled apparel, also posted disappointing results. Its recent-quarter earnings per share and revenue declined 34% and 8.7% y/y, respectively. However, both metrics exceeded analyst consensus expectations. Even though the quarter was one week shorter than in 2023, Boot Barn’s expenses climbed, a result of higher marketing costs, incentive-based compensation and increased wages for store employees.
- Dole plc, however, bucked the trend of weakening revenue with quarterly sales increasing 6% y/y. Better sales volumes across the company’s food commodities supported results while higher prices for avocados provided an additional tailwind, but lower banana prices were a headwind.
- Monday.com, which provides a technology platform for client relationship management and other business functions, reported a 34% y/y increase in revenue. The company’s earnings, after adjusting for one-time expenses, swung from a loss in the year-ago period to a profit.
Rate Cut Expectations Ignite Market Rally
Markets are soaring as today’s weak economic data bolster the case for rate cuts and pushes the S&P 500 and Nasdaq Composite indices to fresh all-time highs. Yields and the dollar are tumbling in unison, providing further support to risk assets. All major US equity benchmarks are higher with the Nasdaq Composite, Russell 2000, S&P 500 and Dow Jones Industrial benchmarks trading up 0.9%, 0.8%, 0.7% and 0.5%. Sectoral breadth is positive with nine out of eleven segments higher on the session being led by technology, real estate and utilities, which are loftier by 1.6%, 1.5% and 1.4%. Energy and consumer discretionary are down 0.3% and 0.1%, meanwhile, a result of plunging oil prices and worries about household finances. Oil prices are lower due to economic slowdown concerns and the International Energy Agency lowering its 2024 demand forecast by 140,000 barrels per day (bpd) to 1.1 million bpd. WTI crude is responding by selling off; it’s down 0.4%, or $0.32, to $78.05 per barrel. Copper and gold are higher, however, a result of strengthening manufacturing prospects on the back of lighter interest rates while investors demand the safe-haven commodity in case of either a recession or geopolitical escalations. Yields are plunging on demand fears and an incrementally shorter journey across the monetary policy bridge with the 2- and 10-year Treasury maturities changing hands at 4.75% and 4.36%, 7 and 8 basis points (bps) lighter on the session. The greenback is suffering for the same reasons with its index at 104.44, lower by 57 bps as it depreciates relative to all of its major counterparts, including the euro, pound sterling, franc, yen, yuan and Aussie and Canadian dollars.
Today’s Data: A Troublesome Combination
Today’s data illustrate persistent inflation even as retail sales remain unchanged, a threat to the current economic expansion. Indeed, GDP growth has slowed sharply from a 3.4% fourth-quarter clip to 1.6% in the first quarter of this year. April’s data, meanwhile, is some of the most important when forecasting second-quarter economic performance, which signals potential turbulence ahead. In past months, consumers have taken breaks in certain periods only to return strongly during subsequent times. Consumer erraticism and the consistent recovery following periods of sluggishness should not be taken for granted. A failure for the consumer to show up at the cash register in May and/or June may produce the first negative GDP print since the second quarter of 2022. As for equities, valuations are stretched at 21 times forward estimates, and should the consumer be exhausted for real this time, earnings projections would need to come down alongside stock prices.
Visit Traders’ Academy to Learn More About the Consumer Price Index and Other Economic Indicators
This post first appeared on May 15th 2024, Traders’ Insight Blog
PHOTO CREDIT: https://www.shutterstock.com/g/Ausettha
Via SHUTTERSTOCK
Disclosure: Interactive Brokers
Information posted on IBKR Campus that is provided by third-parties does NOT constitute a recommendation that you should contract for the services of that third party. Third-party participants who contribute to IBKR Campus are independent of Interactive Brokers and Interactive Brokers does not make any representations or warranties concerning the services offered, their past or future performance, or the accuracy of the information provided by the third party. Past performance is no guarantee of future results.
This material is from IBKR Macroeconomics and is being posted with its permission. The views expressed in this material are solely those of the author and/or IBKR Macroeconomics and Interactive Brokers is not endorsing or recommending any investment or trading discussed in the material. This material is not and should not be construed as an offer to buy or sell any security. It should not be construed as research or investment advice or a recommendation to buy, sell or hold any security or commodity. This material does not and is not intended to take into account the particular financial conditions, investment objectives or requirements of individual customers. Before acting on this material, you should consider whether it is suitable for your particular circumstances and, as necessary, seek professional advice.


