“Life is just a party and parties weren’t meant to last.” That’s a nice turn of phrase from 1999, Prince’s monster hit from back in the early 1980s. It also sums up nicely the bearish point of view on the record-breaking bull market that started in March of 2009. On May 13, the S&P 500 Index (SPX) hit an all-time high of 1,633.77 and the Dow Jones Industrial Average (DJIA) surpassed the 15,000 mark last week.

Market commentators like John Reeves are wondering if we are in the midst of a stock bubble. Others argue that the stock market is riding one giant sugar buzz courtesy of the Fed’s aggressive quantitative easing program and doesn’t accurately reflect the real problems facing the economy.
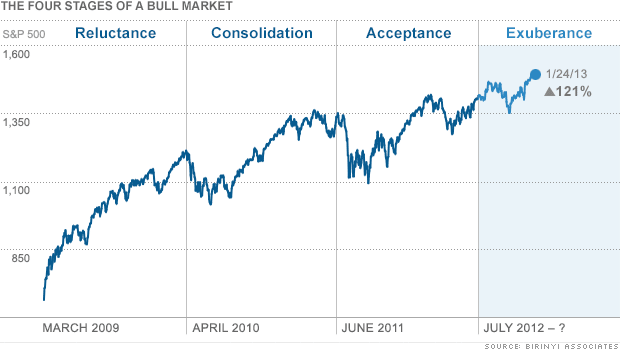
Market analyst Laszlo Birinyi finds that market rallies follow predictable patterns – since 1962, he says, they have tended to last around four years. (The current bull market run is the eight longest in history.) As you can see from the chart below from Hibah Yousuf at CNNMoney, we are now in the “exuberance phase” of the stock price run-up—and might have another couple of years before we tank and start over, according to Binrinyi.
Yet Bloomberg’s Whitney Kisling is out with a story this week that manages to give both the bears and the bulls something to chew on. The S&P 500 Index has gained about 26% annually (including dividends) since March 2009 – about the same pace as the last five years of the dot.com stock market bubble during the late 1990s. That’s right, this bull market is rallying like it’s 1999.
However, there’s a big difference. Back in the go-go late-1990s, stocks traded at about 25.7 times annual profit levels. Today, shares change hands at just 18.6 times. The upshot: It all depends on your outlook. Explains Kisling:
For bulls, the valuations show stocks will keep rising after the S&P 500 advanced 164 percent as individuals scarred by the worst financial meltdown since the Great Depression return to equities. Bears say the price-earnings ratios mean investors lack confidence in the economy and corporate profit growth. They also note that the last time returns were this high, the bubble popped and more than $5 trillion was erased from the value of U.S. stocks, according to data from the World Bank.
Eddy Elfenbein, editor of Crossing Wall Street, notes that the price-earnings ratio of the S&P 500 has hit a three-year high of 16.49, but is still relatively cheap by historical standards. However, Elfenbein offers a cautionary point about the limitations of this ratio that is illustrated in the chart below.
The P/E Ratio is made up of two numbers, the price and the earnings. Price is a fixed-point number. You know exactly what it is at any point in time. Earnings, however, are a ratio. It’s the amount of money earnings between two points. The P/E Ratio mixes these two numbers. That usually isn’t an issue but sometimes it can be.
The biggest problem is that stock prices look ahead while earnings tell you what just happened. Notice how in 2009 the stock market, the black line, correctly anticipated the upturn in earnings, the yellow line. Because of the mismatch, the P/E Ratio soared. I remember this caused a lot of consternation among market bears. The P/E Ratio was telling us the market was expensive when it was really its cheapest.
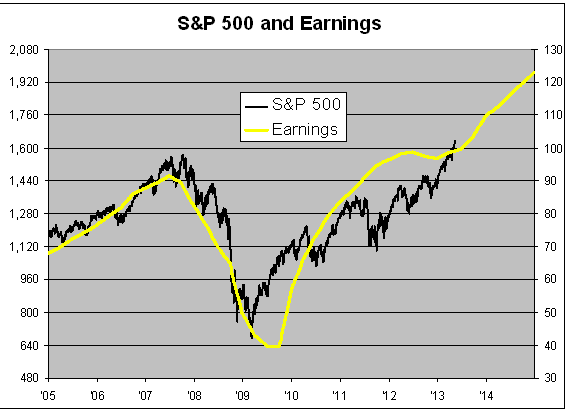
Photo Credit: Nikki319Camille