By: Gerry Sparrow
Stocks largely advanced over a V-shaped week as the AI trade, led by chip stocks, pushed the S&P 500 and Nasdaq averages higher amid renewed conflict.
The Standard & Poor’s 500 Index rose 1.23 percent, while the Nasdaq Composite Index advanced 1.74 percent. The Dow Jones Industrial Average declined 0.50 percent. The MSCI EAFE Index, which tracks developed overseas stock markets, lost 1.42 percent.1,2
Tech-Led Rise Past Geopolitical Concerns
Stocks rose to start the week, with the Dow hitting another record close and the Nasdaq climbing more than 1 percent as investors shook off valuation concerns that plagued AI stocks over the past few weeks.3
The Dow hit a new intraday high on Tuesday before its two-day slide, along with the S&P 500 and Nasdaq, through the week’s lows midday Wednesday. That said, the Nasdaq eked out a slight gain on Wednesday after chip stocks recovered.4,5
After hitting its midweek bottom, stocks climbed through the end of the week. Chip stocks led the rally, pushing higher amid continued Middle East conflict, even as reports emerged that mediators were trying to get the U.S. and Iran back to the negotiating table. A handful of big tech names led the broad market’s rise to finish the week strong, with the S&P 500 and Nasdaq each gaining more than 1 percent on Friday.6,7
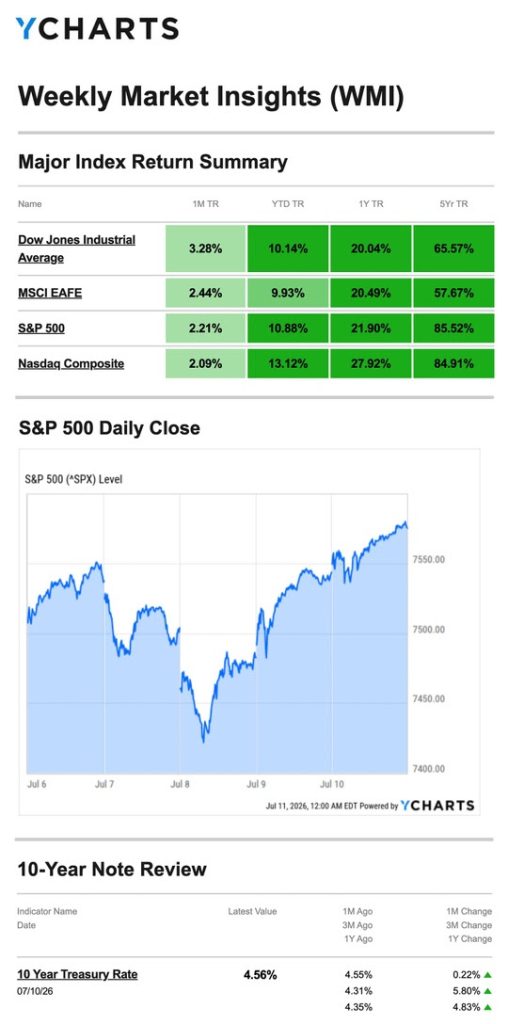
Source: YCharts.com, July 11, 2026. Weekly performance is measured from Monday, July 6, to Friday, July 10. TR = total return for the index, which includes any dividends as well as any other cash distributions during the period. Treasury note yield is expressed in basis points.
A ‘Family Fight’, Vexed by Inflation
Minutes from the Fed’s June meeting were released on Wednesday and revealed a Fed divided and unsure of how to proceed without more inflation data.
Fed officials offered opposing arguments at the meeting about whether to raise or lower interest rates. Fed Chair Warsh called the debate a “family fight” and gave little forward guidance on where the next decision was leaning, adding they would continue to assess “incoming information” on inflation.8
This Week: Key Economic Data
Monday: Treasury Balance.
Tuesday: NFIB Small Business Optimism Index. Consumer Price Index (CPI). Fed Chair Kevin Warsh presents Monetary Policy Report to Congress. Chicago Fed President Austan Goolsbee speaks.
Wednesday: Producer Price Index (PPI). Personal Consumption. New York Fed President John Williams speaks. Fed Beige Book.
Thursday: Retail Sales. Weekly Jobless Claims. Manufacturing & Trade: Inventories & Sales. NAHB Housing Market Index. Pending Home Sales. Dallas Fed President Lorie Logan speaks.
Friday: Housing Starts. Import Prices. Industrial Production. Capacity Utilization. University of Michigan Survey Results.
Source: Investors Business Daily – Econoday economic calendar; July 10, 2026. The Econoday economic calendar lists upcoming U.S. economic data releases (including key economic indicators), Federal Reserve policy meetings, and speaking engagements of Federal Reserve officials. The content is developed from sources believed to provide accurate information. The forecasts or forward-looking statements are based on assumptions and may not materialize. The forecasts are also subject to revision.
PHOTO CREDIT: https://www.shutterstock.com/g/AddMeshCube
VIA SHUTTERSTOCK
FOOTNOTES AND SOURCES
1. WSJ.com, July 10, 2026
2. Investing.com, July 10, 2026
3. WSJ.com, July 6, 2026
4. CNBC.com, July 7, 2026
5. CNBC.com, July 8, 2026
6. CNBC.com, July 9, 2026
7. CNBC.com, July 10, 2026
8. CNBC.com, July 8, 2026
DISCLOSURES
Investing involves risks, and investment decisions should be based on your own goals, time horizon, and tolerance for risk. The return and principal value of investments will fluctuate as market conditions change. When sold, investments may be worth more or less than their original cost.
The forecasts or forward-looking statements are based on assumptions, may not materialize, and are subject to revision without notice.
The market indexes discussed are unmanaged, and generally, considered representative of their respective markets. Index performance is not indicative of the past performance of a particular investment. Indexes do not incur management fees, costs, and expenses. Individuals cannot directly invest in unmanaged indexes. Past performance does not guarantee future results.
The Dow Jones Industrial Average is an unmanaged index that is generally considered representative of large-capitalization companies on the U.S. stock market. The Nasdaq Composite is an index of the common stocks and similar securities listed on the Nasdaq stock market and considered a broad indicator of the performance of stocks of technology and growth companies. The MSCI EAFE Index was created by Morgan Stanley Capital International (MSCI) and serves as a benchmark of the performance of major international equity markets, as represented by 21 major MSCI indexes from Europe, Australia, and Southeast Asia. The S&P 500 Composite Index is an unmanaged group of securities that are considered to be representative of the stock market in general.
U.S. Treasury Notes are guaranteed by the federal government as to the timely payment of principal and interest. However, if you sell a Treasury Note prior to maturity, it may be worth more or less than the original price paid. Fixed income investments are subject to various risks including changes in interest rates, credit quality, inflation risk, market valuations, prepayments, corporate events, tax ramifications and other factors.
International investments carry additional risks, which include differences in financial reporting standards, currency exchange rates, political risks unique to a specific country, foreign taxes and regulations, and the potential for illiquid markets. These factors may result in greater share price volatility.
Please consult your financial professional for additional information.
This content is developed from sources believed to be providing accurate information. The information in this material is not intended as tax or legal advice. Please consult legal or tax professionals for specific information regarding your individual situation. This material was developed and produced by FMG Suite to provide information on a topic that may be of interest. FMG is not affiliated with the named representative, financial professional, Registered Investment Advisor, Broker-Dealer, nor state- or SEC-registered investment advisory firm. The opinions expressed and material provided are for general information, and they should not be considered a solicitation for the purchase or sale of any security.
Important Risk Information
The fund’s investment objectives, risks, charges and expenses must be considered carefully before investing. The prospectus contains this and other important information about the investment company, and it may be obtained by calling 888-727-3301 or visiting www.sparrowcapital.com. Read it carefully before investing.
Investing involves risk of principal loss. Overall stock market risks may affect the value of the Fund. Factors such as domestic economic growth and Market conditions, interest rate levels, and political events affect the securities markets and could case the Fund’s share price.
Stocks of mid-cap companies are riskier than stocks of larger companies. Many of these companies are young and have a limited track record. Their securities may trade less frequently and in more limited volume than those of more mature companies.
Small Cap Risk. To the extent the Fund invests in small-cap companies, the Fund will be subject to additional risks. They include that the earnings and prospects of smaller companies are move volatile than larger companies. Smaller companies may experience higher failure rates than do larger companies.
When the Fund invests in ETF’s and other investment companies, it will indirectly bear its proportionate share of any fees and expenses payable directly by the underlying ETF’s or other investment company. Therefore, the Fund will incur higher expenses. In addition, ETF’s are also subject to the following risks (i) the market price of an ETF’s shares may trade above or below its net asset value; (ii) an active trading market for an ETF’s shares may not develop or be maintained; (iii) trading of an ETF’s shares may be halted if the listing exchange’s officials deem such action appropriate, the shares ate de-listed from the exchange, or the activation of market-wide “circuit breakers” (which are tied to large decreases in stock prices) halts stock trading generally; or (iv) the ETF’s may fail to achieve close correlation with the index that it tracks due to a variety of factors, such as rounding of prices and changes to the index and/or regulatory policies, resulting in the deviating of the ETF’ s returns from that of the index.