By Philip Lawlor, head of Global Markets Research
The epic rally since late March has propelled forward PE multiples across the developed equity markets to some of the highest levels in years. Price/book value ratios have also rebounded, albeit less profoundly. In both cases, the Russell 1000 has set the pace.
Russell 1000 PE hits 15-year high and a big premium
The nearly eight-point rebound in the Russell 1000 forward PE off its March lows has far outdistanced the average five-point gain for its developed peers. At a forward PE of 21.8×, the US large cap index has not only blasted through its mid-February peak but also through its 15-year high. This is also one of the US large cap index’s largest premiums to other developed markets, which have converged around 15-16×.
Regional consensus 12-month forward price/earnings multiples (×)
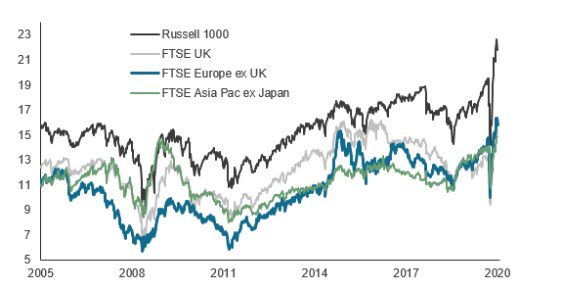
Source: FTSE Russell / Refinitiv. Data through June 15, 2020. Past performance is no guarantee to future results. Please see the end for important disclosures.
Like its developed peers, the Russell 1000’s price/book value ratio has not fully recouped its pre-pandemic peak. However, at 3.2×, this metric rivals some of its highest levels of the past 15 years, while P/Bs elsewhere remain close to their Global Financial Crisis lows. As a result, the gap between the US and other developed indexes has widened significantly.
Regional consensus 12-month forward price/book value (P/B) multiples (×)
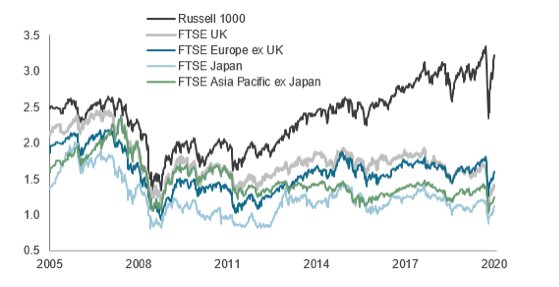
Source: FTSE Russell / Refinitiv. Data through June 15, 2020. Past performance is no guarantee of future results. Please see the end for important legal disclosures.
By these two metrics, US stocks appear expensive, historically and in absolute and relative terms. However, when examined more comprehensively, they look far less stretched than many may think.
Broader view tells a different story
To illustrate, we point to the Valuation Composite scores for the Russell 1000 (blue line) and the FTSE Europe ex UK Index (gray line) since 2000. We derive these composites using a Z-score methodology to measure the number of standard deviations for seven traditional valuation metrics (including ROE) versus their long-term historical averages. Scores range from 1 (low) to 5 (high).
As shown, the valuation composite scores for both the Russell 1000 and the FTSE Europe ex UK have rebounded from their late March lows to roughly comparable levels of just under 4 currently, exceeding their average scores of around 3 since 2013 but below 15-year peaks.
Russell 1000 and FTSE Europe ex UK composite valuation Z-scores
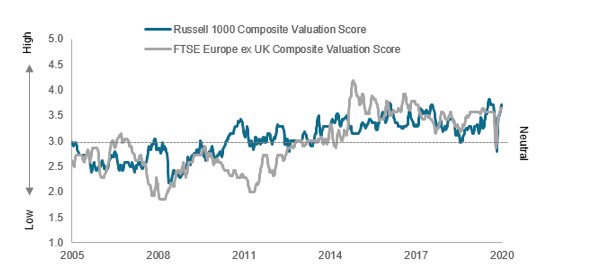
Source: FTSE Russell / Refinitiv. Data through June 15, 2020. Past performance is no guarantee of future results. Please see the end for important legal disclosures.
For a more granular view, the heat map below shows how each of the seven valuation inputs currently measure up across regions. The Russell 1000 ranks notably higher than its peers based on price/book, sales and cash flow (with scores of 4). The FTSE Europe ex UK (along with the FTSE UK) ranks highest on price/EPS growth or PEG (with scores of 5). Emerging markets look the least expensive of the six indexes, with a composite of 2.9, mostly reflecting a lower price/cash flow score than most of its peers.
Regional Valuation Heat Map–Combined
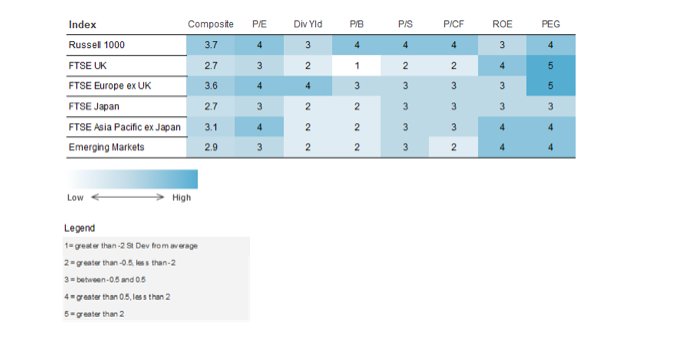
Source: FTSE Russell / Refinitiv. Data as of June 15, 2020. Past performance is no guarantee of future results. Please see the end for important legal disclosures.
Photo Credit: john.purvis via Flickr Creative Commons
© 2020 London Stock Exchange Group plc and its applicable group undertakings (the “LSE Group”). The LSE Group includes (1) FTSE International Limited (“FTSE”), (2) Frank Russell Company (“Russell”), (3) FTSE Global Debt Capital Markets Inc. and FTSE Global Debt Capital Markets Limited (together, “FTSE Canada”), (4) MTSNext Limited (“MTSNext”), (5) Mergent, Inc. (“Mergent”), (6) FTSE Fixed Income LLC (“FTSE FI”), (7) The Yield Book Inc (“YB”) and (8) Beyond Ratings S.A.S. (“BR”). All rights reserved.
FTSE Russell® is a trading name of FTSE, Russell, FTSE Canada, MTSNext, Mergent, FTSE FI, YB and BR. “FTSE®”, “Russell®”, “FTSE Russell®”, “MTS®”, “FTSE4Good®”, “ICB®”, “Mergent®”, “The Yield Book®”, “Beyond Ratings®” and all other trademarks and service marks used herein (whether registered or unregistered) are trademarks and/or service marks owned or licensed by the applicable member of the LSE Group or their respective licensors and are owned, or used under licence, by FTSE, Russell, MTSNext, FTSE Canada, Mergent, FTSE FI, YB or BR. FTSE International Limited is authorised and regulated by the Financial Conduct Authority as a benchmark administrator.
All information is provided for information purposes only. All information and data contained in this publication is obtained by the LSE Group, from sources believed by it to be accurate and reliable. Because of the possibility of human and mechanical error as well as other factors, however, such information and data is provided “as is” without warranty of any kind. No member of the LSE Group nor their respective directors, officers, employees, partners or licensors make any claim, prediction, warranty or representation whatsoever, expressly or impliedly, either as to the accuracy, timeliness, completeness, merchantability of any information or of results to be obtained from the use of FTSE Russell products, including but not limited to indexes, data and analytics, or the fitness or suitability of the FTSE Russell products for any particular purpose to which they might be put. Any representation of historical data accessible through FTSE Russell products is provided for information purposes only and is not a reliable indicator of future performance.
No responsibility or liability can be accepted by any member of the LSE Group nor their respective directors, officers, employees, partners or licensors for (a) any loss or damage in whole or in part caused by, resulting from, or relating to any error (negligent or otherwise) or other circumstance involved in procuring, collecting, compiling, interpreting, analysing, editing, transcribing, transmitting, communicating or delivering any such information or data or from use of this document or links to this document or (b) any direct, indirect, special, consequential or incidental damages whatsoever, even if any member of the LSE Group is advised in advance of the possibility of such damages, resulting from the use of, or inability to use, such information.
No member of the LSE Group nor their respective directors, officers, employees, partners or licensors provide investment advice and nothing contained in this document or accessible through FTSE Russell Indexes, including statistical data and industry reports, should be taken as constituting financial or investment advice or a financial promotion.
Past performance is no guarantee of future results. Charts and graphs are provided for illustrative purposes only. Index returns shown may not represent the results of the actual trading of investable assets. Certain returns shown may reflect back-tested performance. All performance presented prior to the index inception date is back-tested performance. Back-tested performance is not actual performance, but is hypothetical. The back-test calculations are based on the same methodology that was in effect when the index was officially launched. However, back- tested data may reflect the application of the index methodology with the benefit of hindsight, and the historic calculations of an index may change from month to month based on revisions to the underlying economic data used in the calculation of the index.
This publication may contain forward-looking assessments. These are based upon a number of assumptions concerning future conditions that ultimately may prove to be inaccurate. Such forward-looking assessments are subject to risks and uncertainties and may be affected by various factors that may cause actual results to differ materially. No member of the LSE Group nor their licensors assume any duty to and do not undertake to update forward-looking assessments.
No part of this information may be reproduced, stored in a retrieval system or transmitted in any form or by any means, electronic, mechanical, photocopying, recording or otherwise, without prior written permission of the applicable member of the LSE Group. Use and distribution of the LSE Group data requires a licence from FTSE, Russell, FTSE Canada, MTSNext, Mergent, FTSE FI, YB and/or their respective licensors.