By: Matthew J. Bartolini, CFA, CAIA, Global Head of Research
Financials may shine post Fed rate cut, with strong fundamentals and earnings growth creating new investment opportunities in the sector.
Even after one of the strongest earnings seasons for any sector, Financials continues to trail the broad market.1 And ETF flows show limited investment across the sector.2
But Financials could get a shot in the arm from a surprising source. As counterintuitive as it sounds, Financials has historically outperformed the market after the Federal Reserve (Fed) has cut rates.
Adding that macro tailwind to Financials’ strong fundamentals could create interesting opportunities.
Fundamentals provide a strong starting point
Following second quarter results, our sector earnings sentiment framework ranks Financials third across all sectors, with these attractive vital signs:3
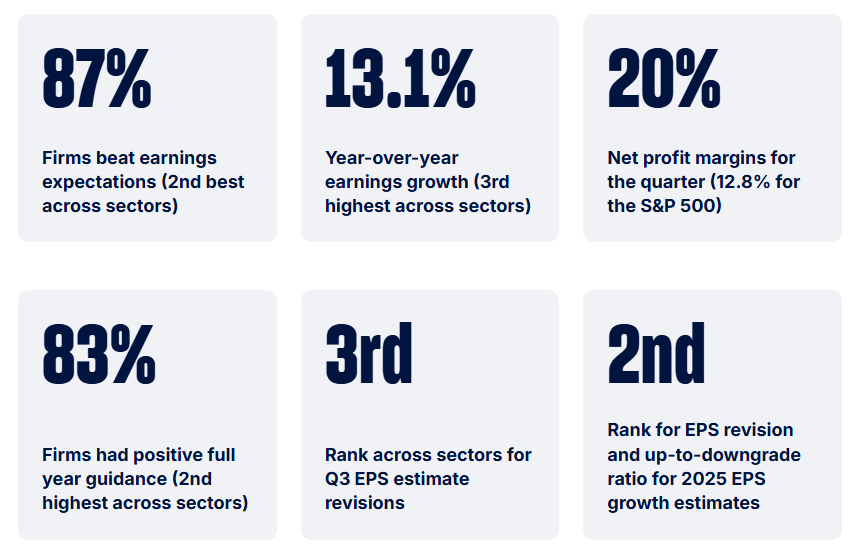
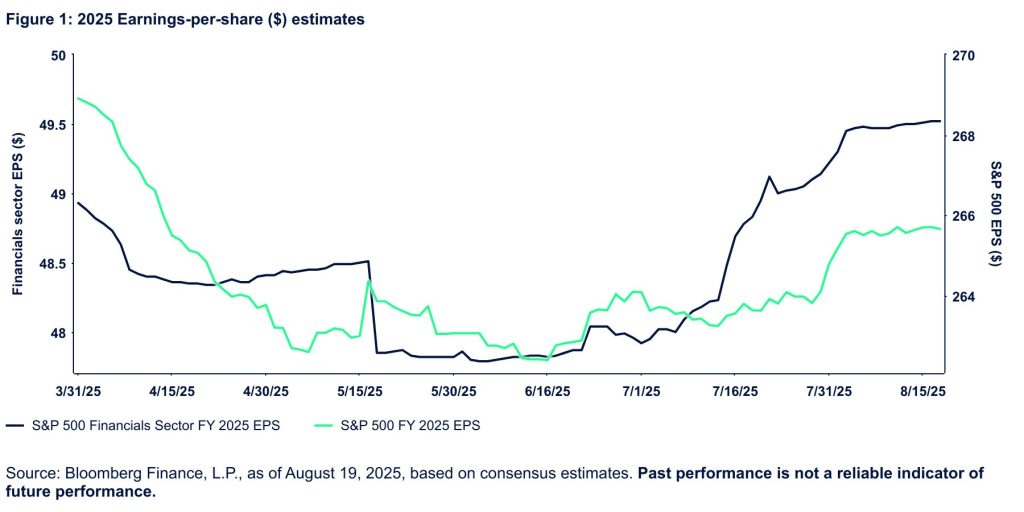
Although the broader market’s full-year 2025 growth expectations have yet to fully recover from the post-Liberation Day reduction, Financials has seen expectations increase (Figure 1).
History supports Financials ahead of the Fed
Financials’ GICS sector historical return streams go back only to 1988, limiting a full picture of performance versus Fed rate cuts. But using the more extensive Fama French Industry Classification returns—a data set that underpinned our business cycle analysis—increases the number of sample periods.
Analyzing the six-month returns following every Fed rate cut since 1970 shows that Financials’ average six-month return following a Fed rate cut was 7.3%. This compares favorably to the market’s average 7.1% return (Figure 2).
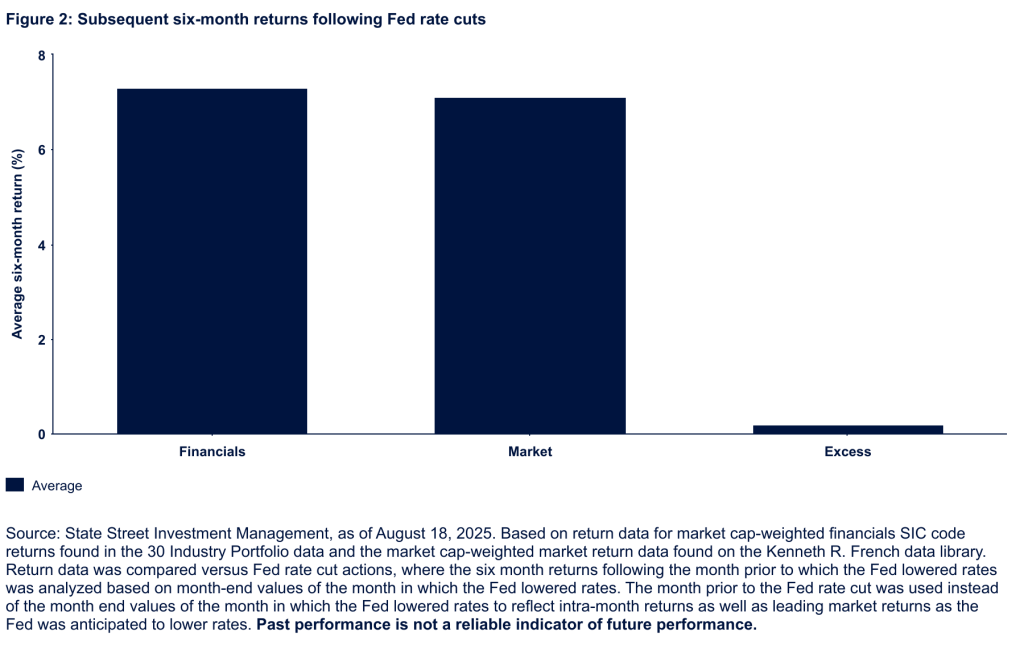
Notably, this data set includes periods when the Fed lowered rates during a crisis or recession. Those actions tend to boost sentiment and come after sizeable market declines (e.g., returns following rate cuts in 2020). And while today’s growth may be subdued, a recession isn’t forecast. Therefore, to make this analysis more analogous to today’s environment, we removed data during recessions.
Following rates cuts, in this more comparable data set, Financials still produces positive absolute returns (6.8%) but now with greater excess returns to the market (0.6% excess return versus 0.2% for all periods) (Figure 3).
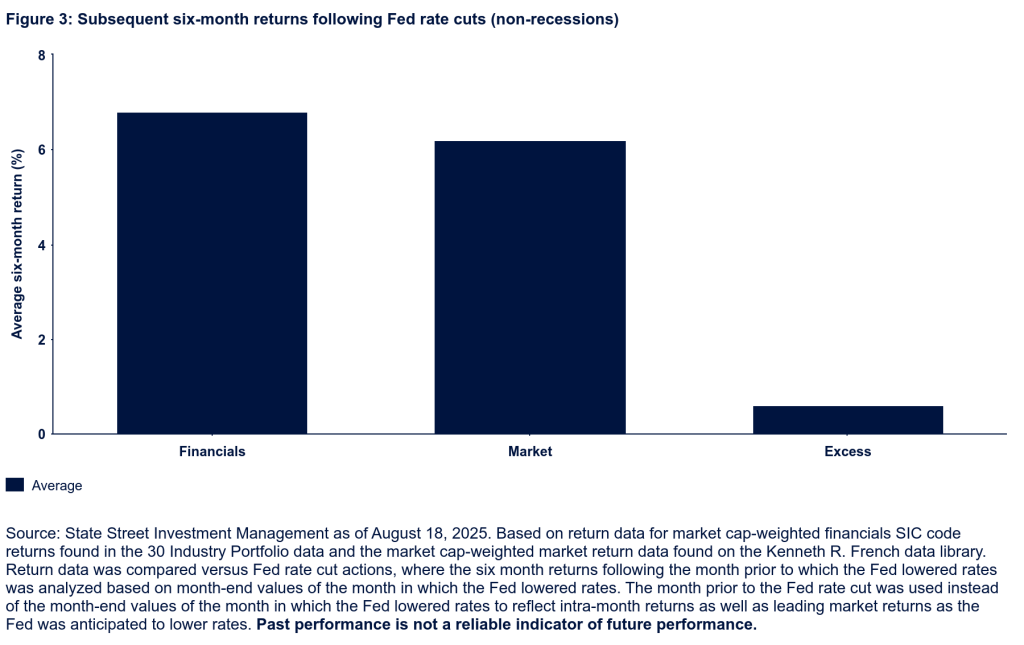
The bias to these returns (absolute and excess) skews positive. In non-recessionary periods when the Fed cut rates, returns were positive 75% of the time (versus 70% positive in all periods). And Financials outperformed the market 60% of the time, both in recessionary and non-recessionary periods.
Macroeconomic dynamics add more support
Yield curve dynamics contribute to Financials historically outperforming the broader market. The Fed has a greater influence on the short end of the curve, while growth and inflation dynamics support longer tenors. And more often than not, a rate cut leads to a steeper yield curve as the Fed pushes down short rates and its dose of stimulus impacts inflation/growth dynamics—either leading to long-term rates not falling as much (or rising) due to greater expected future growth or higher inflation.
A steeper yield curve (lower rates on the short end and higher rates on the long end) can benefit Financials’ profitability and net interest margins (NIMs). Borrowing short term and lending long term is a crucial funding dynamic for banks and financial institutions. While US banks’ NIMs rose slightly to start the year, they remain below pre-pandemic levels—indicating the potential for further improvement.4
When the Fed begins easing, it likely will lead once again to a steeper yield curve. While short-term rates may fall alongside the fedfunds rate, long-term yields are likely to remain anchored or even rise.
Growth may inch higher off less restrictive policy and the stimulus from the One Big Beautiful Bill Act. But inflation is likely to remain stubborn, and tariff impacts have yet to fully materialize.
These growth and inflation dynamics should keep long-term yields elevated and lead to a steeper yield curve than we have today. And given that growth is still projected to be positive, the higher yields that Financials can lend against aren’t likely to be met with offsetting weak aggregate demand that could impact earnings.
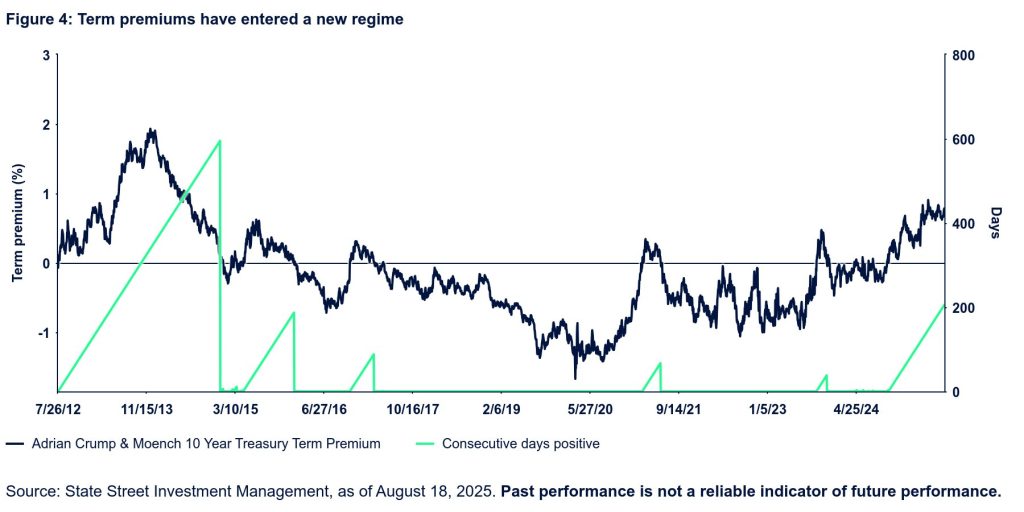
A steeper yield curve’s more structural foundations can add support to NIMs. Longer bonds’ term premium over shorter maturities has now been positive for over 200 consecutive days (Figure 4). This is the longest stretch in more than a decade and illustrates a new curve paradigm brought on by evolving inflation dynamics and alterations in fiscal policies that have raised questions on US Treasurys as a reserve asset.
Financials may find a friend in the Fed this fall
Bottom line: three arrows now point up for Financials:
- Strong fundamentals, both absolute and relative to the market terms
- Historical trends covering more than 50 years of Fed actions
- Macroeconomic dynamics that may widen NIMs and improve sector profitability
Investors seeking to get ahead of the Fed should consider Financials, an under-allocated-to sector that has multiple avenues of potential support.
Originally posted on September 5, 2025 on State Street Management blog
PHOTO CREDIT: https://www.shutterstock.com/g/ICONMAN66
VIA SHUTTERSTOCK
FOOTNOTES AND SOURCES:
1 S&P 500 Financial Sector Index returns = 9.65% versus S&P 500 Index = 9.90% per Bloomberg Finance, L.P., as of August 18, 2025.
2 US-listed Financial Sector ETFs have $300 million of inflows in 2025 so far, per Bloomberg Finance, L.P., and State Street Investment Management, as of August 18, 2025.
3 FactSet, as of August 18, 2025.
4 Banking Analytics: Net Interest Margins Rise at U.S. Banks, Federal Reserve Bank of St. Louis, as of June 10, 2025.
DISCLOSURES:
State Street Global Advisors (SSGA) is now State Street Investment Management. Please go here for more information.
State Street Global Advisors Worldwide Entities
The information provided does not constitute investment advice and it should not be relied on as such. It should not be considered a solicitation to buy or an offer to sell a security. It does not take into account any investor’s particular investment objectives, strategies, tax status or investment horizon. You should consult your tax and financial advisor.
The information contained in this communication is not a research recommendation or ‘investment research’ and is classified as a ‘Marketing Communication’ in accordance with the applicable regional regulation. This means that this marketing communication (a) has not been prepared in accordance with legal requirements designed to promote the independence of investment research (b) is not subject to any prohibition on dealing ahead of the dissemination of investment research.
This communication is directed at professional clients (this includes eligible counterparties as defined by the “appropriate EU regulator”) who are deemed both knowledgeable and experienced in matters relating to investments. The products and services to which this communication relates are only available to such persons and persons of any other description (including retail clients) should not rely on this communication.
The whole or any part of this work may not be reproduced, copied or transmitted or any of its contents disclosed to third parties without SSGA’s express written consent.
Investing involves risk including the risk of loss of principal.
All information is from State Street Investment Management unless otherwise noted and has been obtained from sources believed to be reliable, but its accuracy is not guaranteed. There is no representation or warranty as to the current accuracy, reliability or completeness of, nor liability for, decisions based on such information and it should not be relied on as such.
The views expressed in this material are the views of Matthew J Bartolini through the period ended August 18, 2025, and are subject to change based on market and other conditions. This document contains certain statements that may be deemed forward-looking statements. Please note that any such statements are not guarantees of any future performance and actual results or developments may differ materially from those projected.
Unless otherwise noted, all data and statistical information were obtained from Bloomberg Finance, L.P., and SSGA as of August 18, 2025. Data in tables have been rounded to whole numbers, except for percentages, which have been rounded to the nearest tenth of a percent.
Frequent trading of ETFs could significantly increase commissions and other costs such that they may offset any savings from low fees or costs.