

By: Kevin Flanagan, Head of Fixed Income Strategy
Key Takeaways
- The recent spike in U.S. 30-Year bond yields reflects investor concerns over long-term debt sustainability and fiscal policy shifts.
- Rising 30-Year yields in other major economies like Germany and Japan point to a global aversion to long duration, not just a U.S.-specific issue.
- Despite current volatility, 5% yields may represent a return to historical norms rather than a sign of runaway risk.
Last week, the U.S. Treasury (UST) market witnessed a rather volatile period of trading activity. Of course, things got started with the market digesting the news of Moody’s “one-notch” downgrade of the U.S. credit rating, which was then followed up with news that the House of Representatives had passed the “big, beautiful bill” pertaining to potential future fiscal policy. These two events put tariff-related concerns on the back burner and raised investor anxieties about swelling deficits and increased supply, i.e., debt sustainability.
Typically, the focus of government bond markets is the 10-Year maturity. However, when deficits, attendant supply and debt servicing enter into the conversation, the focus tends to shift more to the longer end of the yield curve, or the 30-Year sector. Why? Because when debt sustainability concerns enter the fray, longer-dated maturities are viewed as potentially the most vulnerable. In other words, what would the federal government have to pay investors to buy their debt for the long run in order to compensate them for this added risk?
Needless to say, at the height of last week’s trading activity, the UST 30-Year bond was generating the lion’s share of the headlines as the yield eclipsed the 5% threshold for the first time since October 2023, when it peaked at 5.11%. Interestingly, at that time, there were concerns regarding the budget deficit and supply as the Treasury debt managers raised the sizes of UST note and bond auctions. Couple that with a Fed that had just finished its aggressive rate hike cycle, and voila, you have 30-Year and 10-Year yields that are 5% at the time.
Now let’s forward to this latest episode, where you have concerns about deficits, Treasury debt loads and a Fed that is showing no signs of pre-emptively cutting rates, and the next thing you know, the 30-Year bond yield topped out at 5.15% in intraday trading, before finishing the week at 5.04%. Interestingly, the 10-Year yield didn’t come close to the 5% threshold, as it peaked at 4.62% and finished only +3 bps higher week/week.
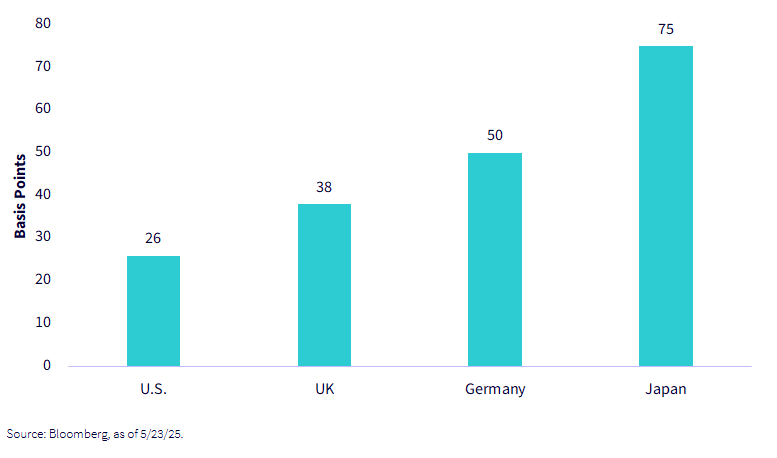
What is more interesting, though, is that the rise in 30-Year yields is not just a U.S. phenomenon. Indeed, in three of the other largest developed sovereign debt markets, the respective 30-Years have also witnessed visible yield increases year-to-date. As the graph included here illustrates, the UK, Germany and Japan 30-Year bond yields have risen anywhere from +38 bps to +75 bps. In contrast, the UST 30-Year rate has risen by a more modest +26 bps.
Digging a little deeper, you can see that the increases in Germany and Japan’s respective 30-Year yields have been two and three times the size of the rise for the U.S. long bond. Were their credit ratings downgraded by Moody’s in the last week or so? Of course not. However, in the case of Germany, its federal government did recently vote for a massive increase in government borrowing to alter its “debt brake,” a rather visible shift in its own fiscal outlook.
To also provide some perspective, a “5%” handle on the UST 30-Year bond is part of our theme of rates returning to normal. From 1988–2007, the average yield was 6.41%. When zero interest rates and negative rates abroad showed up during the 2010–2021 period, the average yield plummeted to an “abnormal” 2.96%. Based on economist forecasts I’ve seen, even if the “big, beautiful bill” becomes law—remember, the Senate still has to weigh in—the fiscal year 2026 budget deficit is not projected to increase by an astronomical amount. Those $3 trillion to $5 trillion increase in debt projections? They are 10-year estimates.
Is the U.S. fiscal path sustainable in the long run? I’m definitely in the “no” camp. However, in the nearer term, if the Treasury debt managers manage to keep note and bond auction sizes relatively constant over the next year, the fundamentals will, as is usually the case, return to prominence.
Conclusion
In my opinion, what we may be seeing now is just a global aversion to long duration.
Originally posted on May 28, 2025 on WisdomTree blog
PHOTO CREDIT: https://www.shutterstock.com/g/Bennian
VIA SHUTTERSTOCK
DISCLOSURES:
U.S. investors only: Click here to obtain a WisdomTree ETF prospectus which contains investment objectives, risks, charges, expenses, and other information; read and consider carefully before investing.
There are risks involved with investing, including possible loss of principal. Foreign investing involves currency, political and economic risk. Funds focusing on a single country, sector and/or funds that emphasize investments in smaller companies may experience greater price volatility. Investments in emerging markets, currency, fixed income and alternative investments include additional risks. Please see prospectus for discussion of risks.
Past performance is not indicative of future results. This material contains the opinions of the author, which are subject to change, and should not to be considered or interpreted as a recommendation to participate in any particular trading strategy, or deemed to be an offer or sale of any investment product and it should not be relied on as such. There is no guarantee that any strategies discussed will work under all market conditions. This material represents an assessment of the market environment at a specific time and is not intended to be a forecast of future events or a guarantee of future results. This material should not be relied upon as research or investment advice regarding any security in particular. The user of this information assumes the entire risk of any use made of the information provided herein. Neither WisdomTree nor its affiliates, nor Foreside Fund Services, LLC, or its affiliates provide tax or legal advice. Investors seeking tax or legal advice should consult their tax or legal advisor. Unless expressly stated otherwise the opinions, interpretations or findings expressed herein do not necessarily represent the views of WisdomTree or any of its affiliates.
The MSCI information may only be used for your internal use, may not be reproduced or re-disseminated in any form and may not be used as a basis for or component of any financial instruments or products or indexes. None of the MSCI information is intended to constitute investment advice or a recommendation to make (or refrain from making) any kind of investment decision and may not be relied on as such. Historical data and analysis should not be taken as an indication or guarantee of any future performance analysis, forecast or prediction. The MSCI information is provided on an “as is” basis and the user of this information assumes the entire risk of any use made of this information. MSCI, each of its affiliates and each entity involved in compiling, computing or creating any MSCI information (collectively, the “MSCI Parties”) expressly disclaims all warranties. With respect to this information, in no event shall any MSCI Party have any liability for any direct, indirect, special, incidental, punitive, consequential (including loss profits) or any other damages (www.msci.com)
Jonathan Steinberg, Jeremy Schwartz, Rick Harper, Christopher Gannatti, Bradley Krom, Kevin Flanagan, Brendan Loftus, Joseph Tenaglia, Jeff Weniger, Matt Wagner, Alejandro Saltiel, Ryan Krystopowicz, Brian Manby, and Scott Welch are registered representatives of Foreside Fund Services, LLC. WisdomTree Funds are distributed by Foreside Fund Services, LLC, in the U.S. only.
You cannot invest directly in an index.


