

It’s that time of year again! Ahead of what was supposed to be a formal unveiling on the Late Show with David Letterman, Sports Illustrated has confirmed that the cover model of this year’s Swimsuit Issue is once again America’s own Kate Upton. While we’re all familiar with the Super Bowl Indicator, have you ever heard of the Sports Illustrated Swimsuit Issue Indicator?
The Swimsuit Issue Indicator says that the US equity markets perform better in years when an American appears on the cover of Sports Illustrated’s annual issue as opposed to years when a non-American appears on the cover.
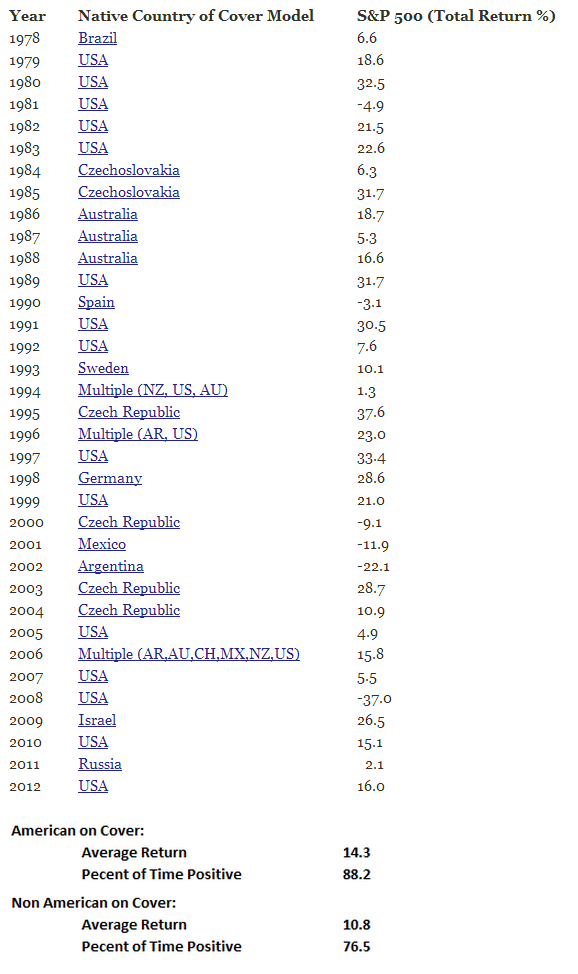
The table below highlights the annual total return of the S&P 500 since 1978. The Swimsuit Issue actually goes as far back as the 1950s, but prior to 1978 it can be difficult to confirm the nationalities and in some cases the names of the cover models. For each year, we also show the country from which that year’s Sports Illustrated Swimsuit Issue cover model came from as well as a link to the cover. Since 1978, an American has now appeared on the cover of the annual issue in 19 different years.
The average total return of the S&P 500 during the 18 prior years has been a gain of 14.4% with positive returns 88.9% of the time. Of the 17 years where a foreigner appeared on the cover, the S&P 500 has averaged a total return of 10.8% with positive returns 76.5% of the time. To be sure, we would note that the S&P 500’s 38.5% decline in 2008 when an American appeared on the cover caused the spread between the two performance numbers to narrow considerably (somebody check Marissa Miller’s birth certificate).
Last year, the Swimsuit Indicator worked like a charm as the S&P 500 saw a total return of 16.0% with Kate Upton’s first cover. Bulls can only hope that the encore (for the market) is equally as good. Since 1978, there have only been three models to get back to back covers on the Swimsuit Issue, and the only American was Christie Brinkley, who was on the cover in 1979, 1980, and 1981. In 1979, the S&P 500 was up 18.6%. It only got better in 1980, when the S&P 500 was up 32.5%. In year three, however, the party ended and the S&P 500 dropped 4.9%.


