By: Michael Kramer, Mott Capital Management
After over two years of Fed pauses, pivots, and uncertainty, the Fed has finally kicked off a new cycle by cutting its overnight rate by 50 bps and delivering an even more dovish dot plot than expected. The Fed removed much of the guesswork this time, clearly signaling they are cutting rates to the neutral level around 3%.
Interestingly, the 10-year rate rose by six bps, which is not what one would typically expect. However, if the 2-year rate is headed toward 3% to 3.25%, and the 10-year usually trades about 200 bps higher than the 2-year, the 10-year could increase slightly from here. This could explain the unexpected rise in the 10-year rate; another factor could be positioning in the market, as always, it will take a day or so to figure that out.
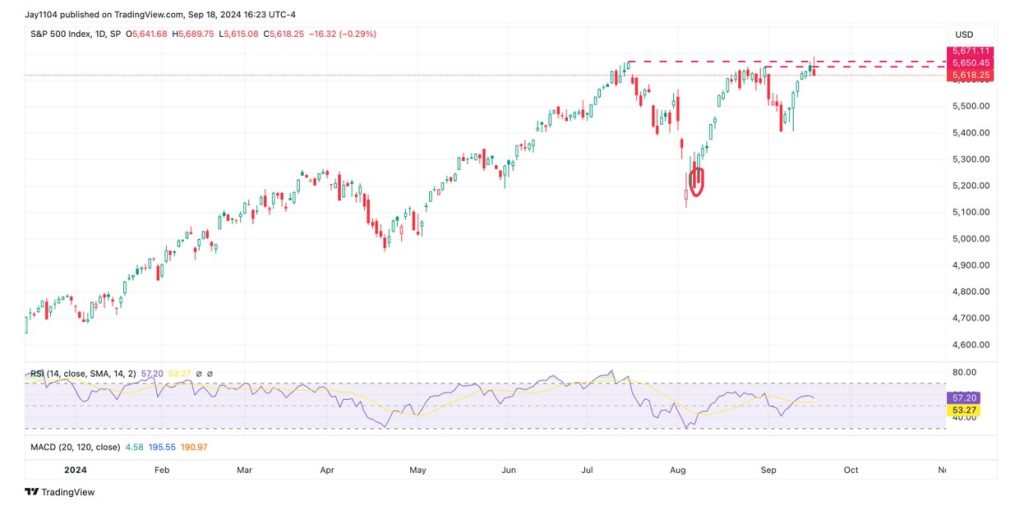
Today’s move in the S&P 500 created a 2B top. The rally pushed well above the July 16 highs, only to close lower and below those previous highs. In my experience, 2B tops have worked fairly well, though not always. If this is a 2B top, we could see a move below the August 5 levels, it start.
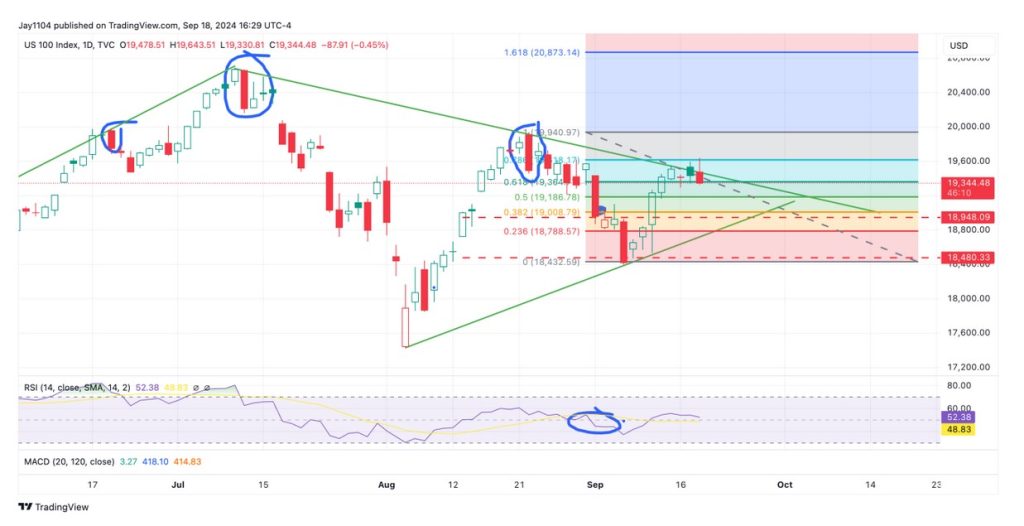
Today, the NASDAQ 100 climbed to the 78.2% retracement level and tested the downtrend for a second consecutive day. So far, it has been unable to make a convincing move higher. At this point, it needs to break higher because if it doesn’t happen tomorrow, the weight of the evidence suggests it could move lower.
The SMH reached the downtrend and the 61.8% retracement level for what appears to be the third time. Semiconductors are a crucial sector in this market, and if they aren’t moving higher, I don’t believe the S&P 500 or NASDAQ will either.
Much of that can be tied back to Nvidia, which has struggled to break above the $120 level. Now that the stock is trading below $115, the question is whether the lower-level call deltas will start to decay as time value diminishes. If Nvidia can’t move higher, then the semis can’t move higher, and neither can the S&P 500 nor the NASDAQ 100.
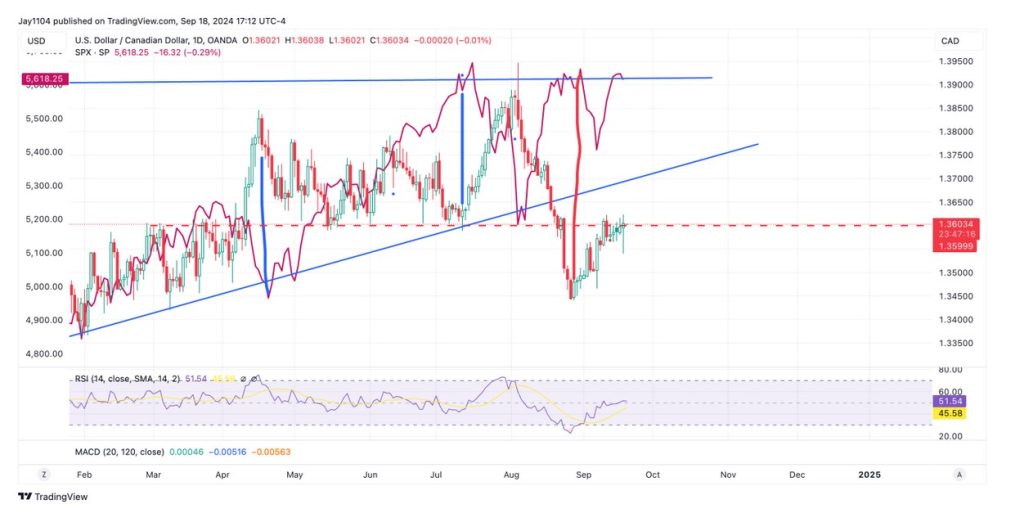
My biggest question is whether the USDCAD will break above the 1.36 level, as it continues to be an excellent tool for spotting S&P 500 tops and bottoms. If the USDCAD can weaken past 1.36, I believe it will confirm that we, indeed the S&P 500 is heading lower.
Today, we received margin numbers from FINRA, which showed that margin levels fell in August. This marks the fourth consecutive month without an increase in margin levels, which could explain why the stock market has been stuck.
Additionally, reserve balances dropped today to $3.22 trillion. Now that the USDJPY has been cut off as a funding currency, the S&P 500 is tracking a few days behind reserve changes. As a result, we may be approaching a point tomorrow where a significant drop could be ready to materialize.
We have to wait and see…
This post first appeared on September 18, 2024 on the Mott Capital Management blog
PHOTO CREDIT: https://www.shutterstock.com/g/PeopleImages-Yuri+A
VIA SHUTTERSTOCK
DISCLOSURES:
Charts used with the permission of Bloomberg Finance L.P. This report contains independent commentary to be used for informational and educational purposes only. Michael Kramer is a member and investment adviser representative with Mott Capital Management. Mr. Kramer is not affiliated with this company and does not serve on the board of any related company that issued this stock. All opinions and analyses presented by Michael Kramer in this analysis or market report are solely Michael Kramer’s views. Readers should not treat any opinion, viewpoint, or prediction expressed by Michael Kramer as a specific solicitation or recommendation to buy or sell a particular security or follow a particular strategy. Michael Kramer’s analyses are based upon information and independent research that he considers reliable, but neither Michael Kramer nor Mott Capital Management guarantees its completeness or accuracy, and it should not be relied upon as such. Michael Kramer is not under any obligation to update or correct any information presented in his analyses. Mr. Kramer’s statements, guidance, and opinions are subject to change without notice. Past performance is not indicative of future results. Neither Michael Kramer nor Mott Capital Management guarantees any specific outcome or profit. You should be aware of the real risk of loss in following any strategy or investment commentary presented in this analysis. Strategies or investments discussed may fluctuate in price or value. Investments or strategies mentioned in this analysis may not be suitable for you. This material does not consider your particular investment objectives, financial situation, or needs and is not intended as a recommendation appropriate for you. You must make an independent decision regarding investments or strategies in this analysis. Upon request, the advisor will provide a list of all recommendations made during the past twelve months. Before acting on information in this analysis, you should consider whether it is suitable for your circumstances and strongly consider seeking advice from your own financial or investment adviser to determine the suitability of any investment.