

By: Anqi Dong, CFA, CAIA, senior research strategist
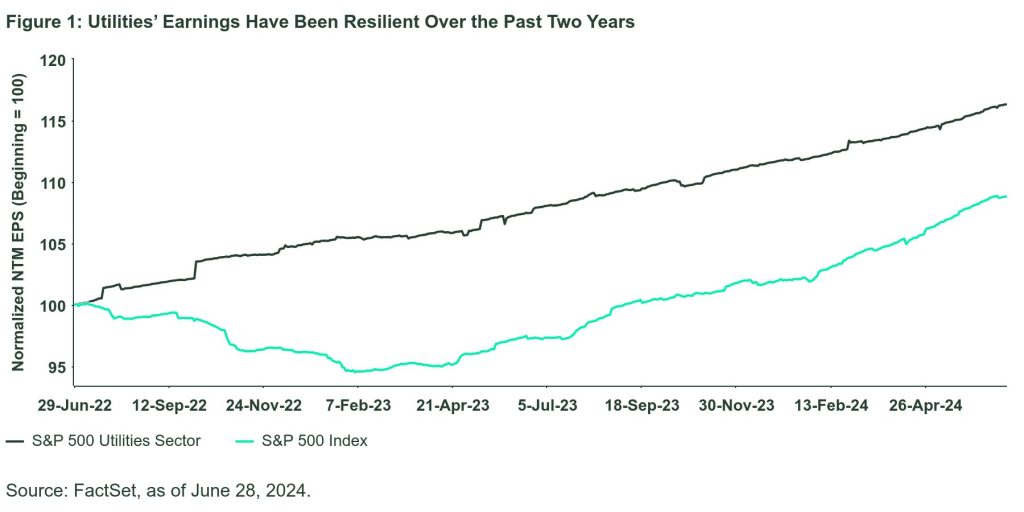
Utilities: Attractive valuations, peaking interest rates, and secular increases in power consumption make the sector a promising underdog.
Aerospace and Defense: Higher defense spending in the face of global conflicts points to great growth potential for the industry.
Oil & Gas Exploration and Production: Constructive supply-demand balance supports the industry fundamentals, while its high sensitivity to inflation and oil prices provide investors a powerful portfolio diversification tool.
Over the longer term, booming data center power consumption, electrification of the transportation sector, and manufacturing reshoring provide secular tailwinds for demand growth in electric utilities. Electricity consumption from data centers could more than double by 2026, assuming no significant improvement on technological efficiency.6 With increasing adoption of electric vehicles, electricity demand from the transportation sector is projected to increase more than eight times by 2050.7
Last but not least, electricity demand from the industrial sector may get a boost from manufacturing onshoring. Based on the analysis of onshoring US manufacturing facilities that has been announced or begun construction between 2021 and 2023, they may increase annual industrial electricity consumption by around 0.65% relative to the 2022 level.8 As the pace of reshoring accelerates, US industrial electricity demand may see the first sustained increase since 2000.9
While Utilities still face near-term headwinds from elevated interest rates, long-term Treasury yields have shown signs of peaking, as so far the Treasury yield has peaked below last year’s highs. This may indicate that the worst rate pains may be behind the sector. Current valuation levels offer attractive entry points for investors.
Aerospace & Defense: Higher Defense Spending and Potential Tailwinds After the US Election
The Aerospace & Defense industry has underperformed broad US equities and its European peers by more than 10% year to date10 due to US defense budget and supply chain constraints. But looking beyond the near-term headwinds, we remain positive on the multi-year cycle of higher defense spending amid intensifying competition between powerful nations and increasing geopolitical fragmentation.
While the US defense budget for FY 2024 and 2025 was constrained by last year’s debt ceiling deal limiting the defense budget increase to 1% from the previous year, global military expenditures continue to show strong momentum led by increases in Europe and the Middle East. As European countries’ threat perceptions were dramatically shifted by the Russia-Ukraine war, we saw the highest number of NATO members meeting or surpassing the 2% of GDP on defense spending target last year, lifting the region’s defense spending by 16%.11
Military expenditures in the Middle East registered the highest annual growth since 2014, driven by large increases in Saudi Arabia and Israel12 as diplomatic relations between Israel and Arab countries deteriorated amid the war in Gaza. Iran’s retaliatory attacks on Israel and Israel’s military response in April heightened the risk of wider regional conflicts, potentially boosting Arab countries’ military spending in the coming year.
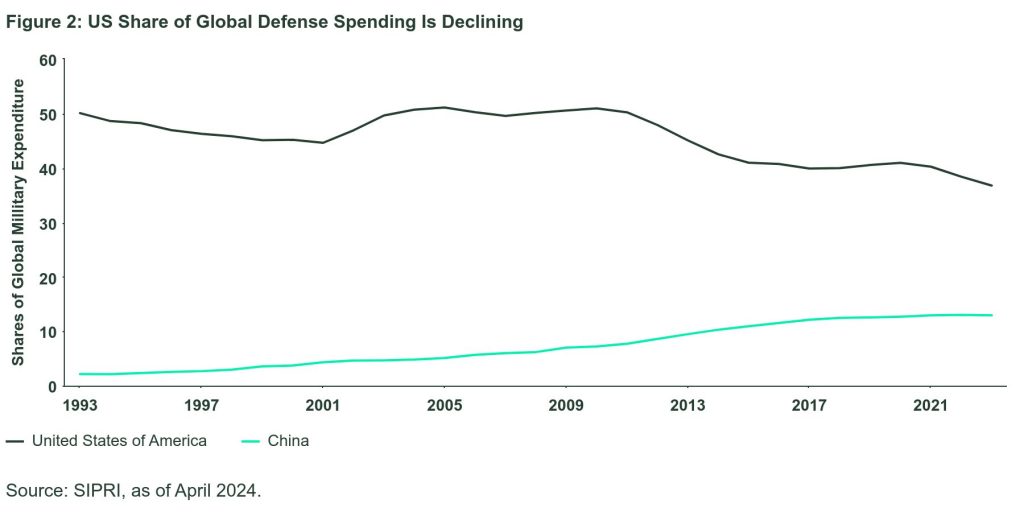
Additionally, the intensifying rivalry between the US and China around the Taiwan Strait demands higher spending on US defense modernization in the Indo-Pacific region to deter military threats. Notwithstanding debate on whether China’s official defense budget captures most of its actual defense spending, the US share of global military spending has declined over the past decade, while China’s share of global spending has increased (Figure 2).
Although the FY 2024 US defense budget is more than triple China’s in absolute terms, US defense spending has a global footprint, compared to China’s Indo-Pacific focus. Moreover, the same dollar amount allows China to go further in military buildup and modernization given its lower domestic labor and material costs.
With established higher global defense spending trends and bipartisan agreement on strengthening military competitiveness to maintain US global dominance, the recent stall in defense budget growth may be revisited after the US presidential election, regardless of the party that controls the White House and Congress.
Defense stocks have historically outperformed the S&P 500 in eight of 10 election years by an average of 9% since 1984 (excluding the more than 30% outperformance in 2000). Given defense’s year-to-date underperformance and potential political tailwinds following the election, the industry may play catch up in the second half of this year. Meanwhile, the 33% gap between the defense modernization budget and actual cash outlays over the past 12 months may sustain defense contractors’ revenue growth of 10% in the next two years given their historical high correlation,13 supporting the industry’s growth outlook.
Oil & Gas Exploration and Production: A Catch-up Play with Oil Prices While Hedging Inflation and Geopolitical Risks
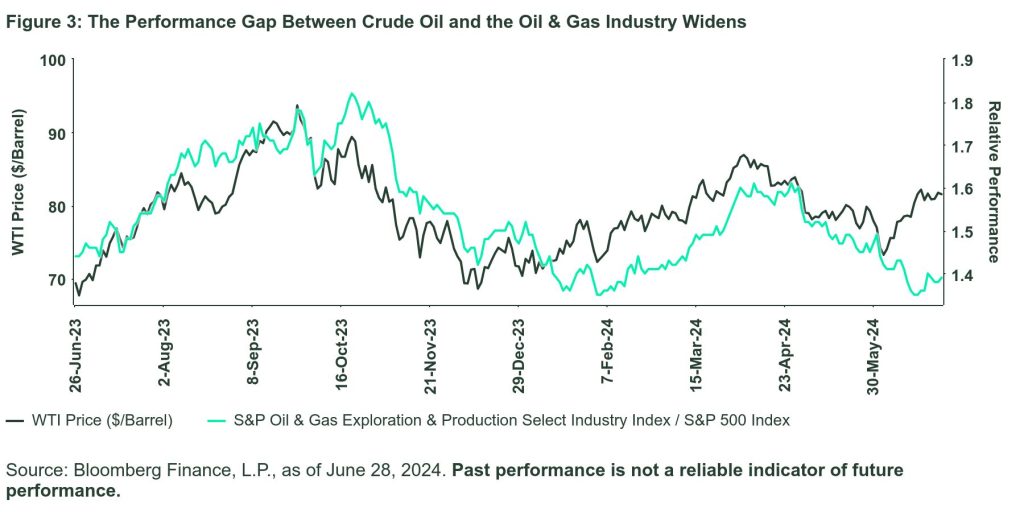
While crude oil prices have rebounded from below $75 per barrel in June, stocks of oil & gas explorers and producers continued the downward trend, lagging the performance of crude oil prices and broad equities by 15.2% and 6.6%, respectively, over the past year14 (Figure 3). On the other hand, the industry has shown positive earnings sentiment in Q2, with 2024 and 2025 earnings growth estimates revised higher and the number of upgrades exceeding downgrades by large margins. Lower stock prices and stronger earnings have kept the industry forward P/E valuations at the bottom quartile of the past 10 years and around 50% discount to the broad market.15
Soft demand, inventory buildup, and growth in US shale production have been the major concerns in the oil market, even though in its June meeting OPEC+ extended the voluntary production cuts to September and the broader output cuts a year beyond their scheduled timeline.
While the increase in US crude oil inventory appears alarming, the current inventory level is merely on par with last year’s level. The upcoming seasonal higher demand and the OPEC’s voluntary production cuts throughout the summer increase the odds of crude oil inventory decline in Q3, supporting oil prices. Considering the crude oil refinery forecast runs in the following month, days of crude oil supply excluding Strategic Petroleum Reserve are actually shorter than last year.16
The surprisingly strong growth in US shale production in the second half of last year caught energy investors off guard, with WTI crude oil prices closing the year around $70. The steeper-than-normal drawdown of the drilled but uncompleted wells inventory was likely behind the jump in production.17 The risk of repeating a positive supply surprise is limited given the low inventory of drilled but uncompleted wells and last year’s 30% decline in US horizontal rig counts, a leading indicator of shale oil production trends. Indeed, the three-month moving average of US oil production registered its fourth straight month of negative three-month growth in April.18
Potential softer demand amid a sharper global economic slowdown later this year poses a key downside risk to energy related exposures. However, the near-term supply and demand balance is constructive given continued OPEC output cuts, the resilient US economy, and global manufacturing recovery. The OPEC+’s recent track record of constraining supply to support oil prices may also help limit downside risk. And the potential negative supply shock driven by a wider regional conflict in the Middle East may create a deficit in the oil market, bolstering energy stocks’ outperformance over the broad market.
Originally Posted July 16th, 2024, SSGA
PHOTO CREDIT: https://www.shutterstock.com/g/Piscine
Via SHUTTERSTOCK
Footnotes
1 Bloomberg Finance, L.P., as of June 28, 2024.
2 FactSet, as of June 28, 2024.
3 FactSet, as of June 26, 2024.
4 FactSet, as of June 26, 2024.
5 Rate base is the value of property on which a public utility is permitted to earn a specified rate of return in accordance with rules set by a regulatory agency.
6 IEA, Electricity 2024 Report.
7 EIA, Annual Energy Outlook 2023.
8 EPRI, Reindustrialization, Decarbonization and Prospects for Demand Growth, July 2023.
9 EPRI, Reindustrialization, Decarbonization and Prospects for Demand Growth, July 2023.
10 Bloomberg Finance, L.P., as of June 26, 2024.
11 SIPRI, as of April 2024.
12 SIPRI, as of April 2024.
13 Barclays, May 13, 2024.
14 Bloomberg Finance, L.P., as of June 28, 2024.
15 FactSet, as of June 28, 2024. The industry is represented by the S&P Oil & Gas Explorers and Production Select Industry Index. The Broad market is represented by the S&P 1500 Index.
16 EIA, as of June 28, 2024.
17 Barclays, June 28, 2024.
18 EIA, as of June 28, 2024.
19 Bloomberg Finance, L.P., as of June 28, 2024. Beta is measured for the 10-year period ending on June 28, 2024. Inflation expectation is represented by the 10-year breakeven rate.
Disclosure
Important Risk Disclosure
The views expressed in this material are the views of the SPDR Research and Strategy team through the period ended June 28, 2024, and are subject to change based on market and other conditions. This document contains certain statements that may be deemed forward-looking statements. Please note that any such statements are not guarantees of any future performance and actual results or developments may differ materially from those projected.
This communication is not intended to be an investment recommendation or investment advice and should not be relied upon as such.
All information is from SSGA unless otherwise noted and has been obtained from sources believed to be reliable, but its accuracy is not guaranteed. There is no representation or warranty as to the current accuracy, reliability or completeness of, nor liability for, decisions based on such information and it should not be relied on as such.
Investing involves risk including the risk of loss of principal.
ETFs trade like stocks, are subject to investment risk, fluctuate in market value and may trade at prices above or below the ETFs net asset value. Brokerage commissions and ETF expenses will reduce returns.
The S&P 500® Index is a product of S&P Dow Jones Indices LLC or its affiliates (“S&P DJI”) and have been licensed for use by State Street Global Advisors. S&P®, SPDR®, S&P 500®,US 500 and the 500 are trademarks of Standard & Poor’s Financial Services LLC (“S&P”); Dow Jones® is a registered trademark of Dow Jones Trademark Holdings LLC (“Dow Jones”) and has been licensed for use by S&P Dow Jones Indices; and these trademarks have been licensed for use by S&P DJI and sublicensed for certain purposes by State Street Global Advisors. The fund is not sponsored, endorsed, sold or promoted by S&P DJI, Dow Jones, S&P, their respective affiliates, and none of such parties make any representation regarding the advisability of investing in such product(s) nor do they have any liability for any errors, omissions, or interruptions of these indices.
Equity securities may fluctuate in value and can decline significantly in response to the activities of individual companies and general market and economic conditions.
There can be no assurance that a liquid market will be maintained for ETF shares.
Concentrated investments in a particular sector or industry tend to be more volatile than the overall market and increases risk that events negatively affecting such sectors or industries could reduce returns, potentially causing the value of a Fund’s shares to decrease.
Non-diversified funds that focus on a relatively small number of securities tend to be more volatile than diversified funds and the market as a whole.
While the shares of ETFs are tradable on secondary markets, they may not readily trade in all market conditions and may trade at significant discounts in periods of market stress.
When the Fund focuses its investments in a particular industry or sector, financial, economic, business, and other developments affecting issuers in that industry, market, or economic sector will have a greater effect on the Fund than if it had not done so.
Passively managed funds invest by sampling the Index, holding a range of securities that, in the aggregate, approximates the full Index in terms of key risk factors and other characteristics. This may cause the fund to experience tracking errors relative to performance of the Index.
The whole or any part of this work may not be reproduced, copied or transmitted or any of its contents disclosed to third parties without SSGA’s express written consent.
The trademarks and service marks referenced herein are the property of their respective owners. Third party data providers make no warranties or representations of any kind relating to the accuracy, completeness or timeliness of the data and have no liability for damages of any kind relating to the use of such data.


