

By: Matthew J Bartolini, CFA, CAIA, Head of SPDR Americas Research and Colin J Ireland, CFA , Sales Execution and Institutional Strategy
- Because an ETF can be bought and sold on an exchange like a stock and incurs trading costs, your total cost of ownership (TCO) evaluation should include both trading and holding costs.
- Low fees do not naturally lead to low trading costs and, as a result, the lowest TCO.
- Focusing on variables like strategy type, holding period, rebalance frequency, and portfolio turnover may have the most impact on your portfolio when lowering costs.
When choosing from the more than 3,000 US-listed exchange traded funds (ETFs),1 there are four major areas of due diligence:
- Cost
- Risk/return
- Holdings make-up
- Tracking accuracy for index-based strategies or the manager’s investment process for active funds
While the last three are often heavily scrutinized, many analyze cost more simply, focusing solely on an ETF’s expense ratio. However, it’s important to evaluate an ETF’s total cost of ownership (TCO).
Low Expense Ratios Don’t Always Mean the Lowest TCO
Because an ETF can be bought and sold on an exchange like a stock and incurs trading costs, your TCO evaluation should include both trading and holding costs. Low fees do not naturally lead to low trading costs and, as a result, the lowest TCO.
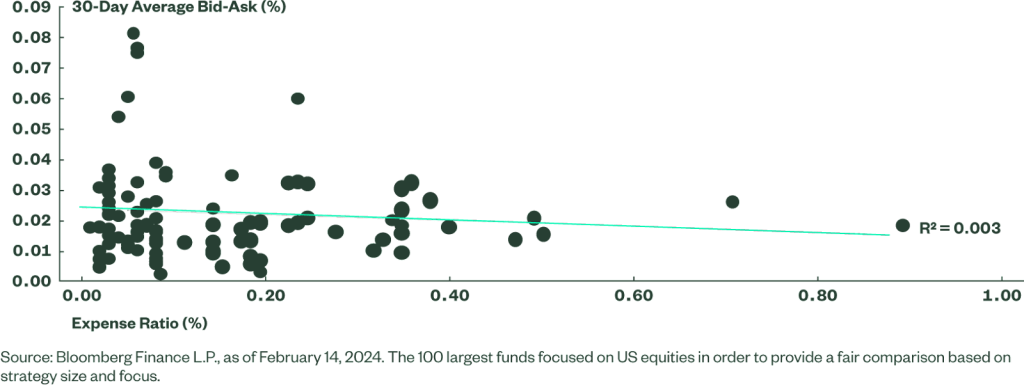
Figure 1 plots the 30-day average bid-ask spread versus the expense ratio for the 100 largest US equity ETFs, clearly illustrating the lack of correlation between ETFs’ expense ratios and trading costs. As a result of differences in secondary market liquidity profiles, some higher fee funds have lower bid-ask spreads, and some lower fee funds have higher bid-ask spreads.
Figure 1: Bid-Ask Spread Versus Expense Ratio for the 100 Largest ETFs Focused on US Equities
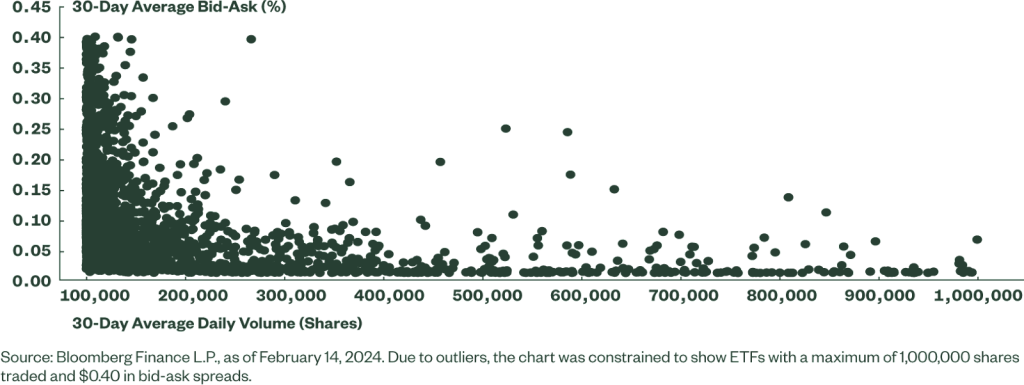
While there is no correlation between fees and trading costs, there is a strong relationship between trading volumes and trading costs. Funds with higher average daily volumes tend to have lower bid-ask spreads than do funds with lower volumes as shown in Figure 2.
Figure 2: US-Listed ETF Bid-Ask Spread Versus Trading Volumes
Therefore, much like calculating the money paid in fund fees on an investment, the calculation of trading costs must also be included in any model used to make pre-investment decisions, as well as during the ongoing review of the TCO for a particular ETF.
The following hypothetical example compares the overall cost of two ETFs that seek to track the same index but have different expense ratios and rebalancing costs (after a hypothetical 20% annual gain on the original investment.)
As shown in Figure 3, trading costs make Fund XYZ, the fund with the higher expense ratio, the lower-cost option in this annual rebalance scenario. And the more frequent the rebalancing, and the greater the size of the rebalance, the greater the impact on the total cost of ownership.
When a position is established, the trading costs are applied to the total notional dollar figure; for ABC ETF, this would be the 0.05% applied to the $10 million position.
Figure 3: Hypothetical Example: Rebalance Trade Highlights Cost-Analysis Nuances, Part 1
| Information | ABC | XYZ |
| Expense Ratio | 0.07% | 0.10% |
| 30-Day Avg. Bid-Ask Spread | 0.05% | 0.01% |
| Portfolio Amount | $10,000,000 | $10,000,000 |
| Portfolio Amount After 1 Year | $12,000,000 | $12,000,000 |
| Sell Amount | $2,000,000 | $2,000,000 |
| Cost | ||
| Holding (Expense Ratio * Average Yearly Assets) | $7,700 | $11,000 |
| Trading Costs – Purchase (Original) | $5,000 | $1,000 |
| Trading Costs – Sale Amount | $1,000 | $200 |
| Total Costs | $13,700 | $12,200 |
| Total Costs as Percent of Average Assets | 0.12% | 0.11% |
Source: State Street Global Advisors, as of February 14, 2024. This hypothetical illustration seeks to illustrate why choosing an ETF based solely on a lower expense ratio could result in higher total costs. ETFs have trading-related costs that add to the total cost of an ETF, so investors have to look beyond the expense ratio to add in trading costs.
This is similar to the application of an expense ratio. But any rebalancing trades are applied only to the notional value traded — in this case the $2 million, which is just a portion of the total portfolio value.
So, what if the current holding position was cut in half, leading to a $6 million notional trade value? As shown below in Part 2 of our hypothetical example, as the size of the portfolio turnover increases, so do the costs — compounding the cost advantage of XYZ over ABC, even though ABC has a lower expense ratio.
It is important to note that the examples omit some trading nuances that should be considered. For example:
- Differences in commission: We list commissions as the same, but in reality, that may not be the case, as some funds are offered commission free. Depending on the trading platform, some trading commissions are calculated on a per-share basis, not based on flat basis points.
- Volatility: We also assume that the trading environment stays the same, with bid-ask spreads near “average” levels when it comes time to trade. Of course, volatility can strike at any time, and an ETF’s liquidity profile can change along with it. We saw this dynamic throughout the COVID-19 era and the regional banking crisis.
Figure 4: Hypothetical Rebalance Trade Highlights Cost-Analysis Nuances, Part 2
| Information | ABC | XYZ |
| Expense Ratio | 0.07% | 0.10% |
| 30-Day Avg. Bid-Ask Spread | 0.05% | 0.01% |
| Portfolio Amount | $10,000,000 | $10,000,000 |
| Portfolio Amount After 1 Year | $12,000,000 | $12,000,000 |
| Sell Amount | $6,000,000 | $6,000,000 |
| Cost | ||
| Holding (Expense Ratio * Average Yearly Assets) | $7,700 | $11,000 |
| Trading Costs – Purchase (Original) | $5,000 | $1,000 |
| Trading Costs – Sale Amount | $3,000 | $600 |
| Total Costs | $15,700 | $12,600 |
| Total Costs as Percent of Average Assets | 0.14% | 0.11% |
Source: State Street Global Advisors, as of February 14, 2024. This hypothetical illustration seeks to illustrate why choosing an ETF based solely on a lower expense ratio could result in higher total costs. ETFs have trading-related costs that add to the total cost of an ETF, so investors have to look beyond the expense ratio to add in trading costs.
Figure 5: The Trade-offs Between Trading and Holding Costs
| Inputs | Higher Emphasis on Expense Ratio | Higher Emphasis on Trading Costs |
| Strategy Type | Strategic | Tactical |
| Holding Period | Long | Short |
| Rebalance Frequency | Low | High |
| Portfolio Turnover | Low | High |
Make It Personal: Balance Trading and Holding Costs
Evaluating an ETF’s TCO involves moving beyond just the expense ratio, liquidity profile, and trading costs to analyze a combination of technical and process drivers.
Consider the following variables when evaluating ETFs with seemingly similar cost profiles:
- Strategy Type The more strategic an investor or the more strategic the allocation is, the more emphasis should be placed on the cost “hold.”
- Holding Period Depending on how tactical or strategic an allocation is, the holding period can change, underscoring why this should be a separate input.
- Rebalance Frequency The more frequently a portfolio is rebalanced, the more emphasis is needed on the costs to trade, even if it is a “strategic” allocation.
- Portfolio Turnover When the size of the turnover increases, so do trading costs.
Focusing on the part of the TCO equation that has the most impact on your portfolio may lower your costs.
While it’s black and white to stress a fund’s expense ratio for buy-and-hold strategies and trading costs for tactical asset allocations, there are gray areas.
Consider a standard 60-40 core allocation comprising three ETFs: a US equity, a global ex-US equity, and a broad global bond fund. While rebalanced monthly based on a momentum signal, where the portfolio weights are also determined, the assets are strategic and will be held for a long time. Notably, weights do not go to zero given that the model solution is meant to provide broad diversification to global assets.
Here, while holding period and strategy type indicate you should emphasize “holding” costs, frequent rebalancing and uncertain size indicate that you should emphasize “trading” costs. To strike a balance between both cost components, consider establishing a “liquidity” component within the portfolio, where you split asset allocations between the lowest expense ratio and the most liquid funds.
Sometimes You Pay Higher Fees for Lower Costs
Depending on your rebalancing size and frequency, trading costs can accumulate significantly and have a larger impact on the total cost of ownership than any expense ratio difference between two ETFs, underscoring why liquidity analysis has to be a part of any due diligence process prior to implementation. Buying an ETF based on its headline expense ratio alone may not lead to the most cost-efficient solution.
Originally Posted February 27th, 2022, SSGA
PHOTO CREDIT: https://www.shutterstock.com/g/romrf
Via SHUTTERSTOCK
Footnotes
1 Morningstar, as of February 14, 2024.
Disclosure
Important Risk Information
Frequent trading of ETFs could significantly increase commissions and other costs, such that they may offset any savings from low fees or costs.
These investments may have difficulty in liquidating an investment position without taking a significant discount from current market value, which can be a significant problem with certain lightly traded securities.
Investing involves risk, including the risk of loss of principal.
The whole or any part of this work may not be reproduced, copied or transmitted or any of its contents disclosed to third parties without SSGA’s express written consent.
The information provided does not constitute investment advice and it should not be relied on as such. It should not be considered a solicitation to buy or an offer to sell a security. It does not take into account any investor’s particular investment objectives, strategies, tax status or investment horizon. You should consult your tax and financial advisor. All information is from SSGA unless otherwise noted and has been obtained from sources believed to be reliable, but its accuracy is not guaranteed. There is no representation or warranty as to the current accuracy, reliability or completeness of, nor liability for, decisions based on such information, and it should not be relied on as such.
Bonds generally present less short-term risk and volatility than stocks but contain interest rate risk (as interest rates raise, bond prices usually fall); issuer default risk; issuer credit risk; liquidity risk; and inflation risk. These effects are usually pronounced for longer-term securities. Any fixed income security sold or redeemed prior to maturity may be subject to a substantial gain or loss.
Equity securities may fluctuate in value in response to the activities of individual companies and general market and economic conditions.
Diversification does not ensure a profit or guarantee against loss.
Investing in commodities entails significant risk and is not appropriate for all investors.
There can be no assurance that a liquid market will be maintained for ETF shares.
