By: Maxwell gold, CFA, Head of Gold Strategy
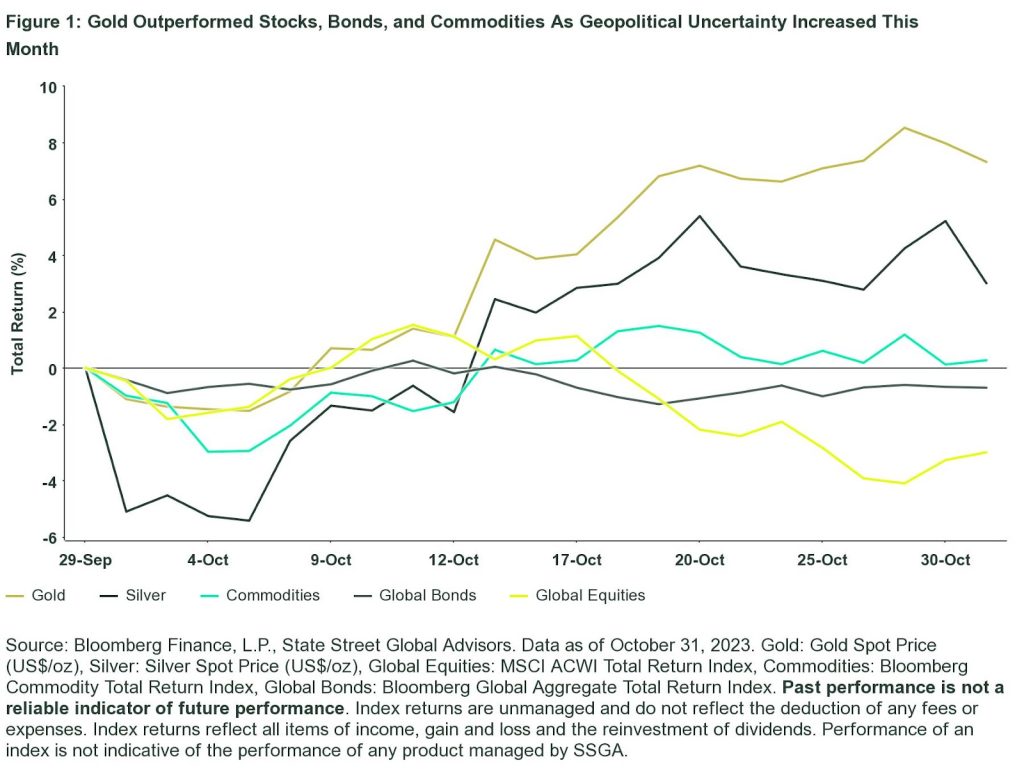
October brought a significant turning point for gold as heightened geopolitical turmoil along with a shifting outlook towards US monetary policy sent the spot price 7.32% higher in US$/oz — the largest monthly gain since March 2023.1 Gold ended the month up 8.76% year to date, while also breaching the psychological threshold of US$2000/oz on October 27 for the first time since May.2 October also marked the third consecutive month of losses in global and US equities — the first time since 2020 — with the S&P 500® Index and the MSCI ACWI Index dropping 2.1% and 3.0% respectively in October, despite the US posting 4.9% gross domestic product (GDP) growth in Q3 2023.3
Gold’s rally was fueled by increased geopolitical volatility following the October 7 Hamas attack on Israel, with Israel responding by declaring war against Hamas in the Gaza strip. Market concerns of a potential escalation of this conflict and regional spillover across the Middle East spurred risk-off sentiment and demand for defensive assets such as gold. As uncertainty in the geopolitical realm remains elevated in the Middle East and Ukraine, gold may continue to see support driven by investor portfolio diversification and safe-haven buying.
Consensus that the Federal Reserve (Fed) was nearing the end of its rate hiking cycle solidified in October. Following a rate pause from the September 20 FOMC meeting, the Fed’s decision to keep rates unchanged on November 1 for the second consecutive meeting confirmed market expectations that had buoyed gold throughout October. Looking ahead, markets continue to price in Fed rate cuts by mid-2024, which should provide support for gold heading into year end.
Gold’s Chart of the Month
Gold Performance Drivers
Flows
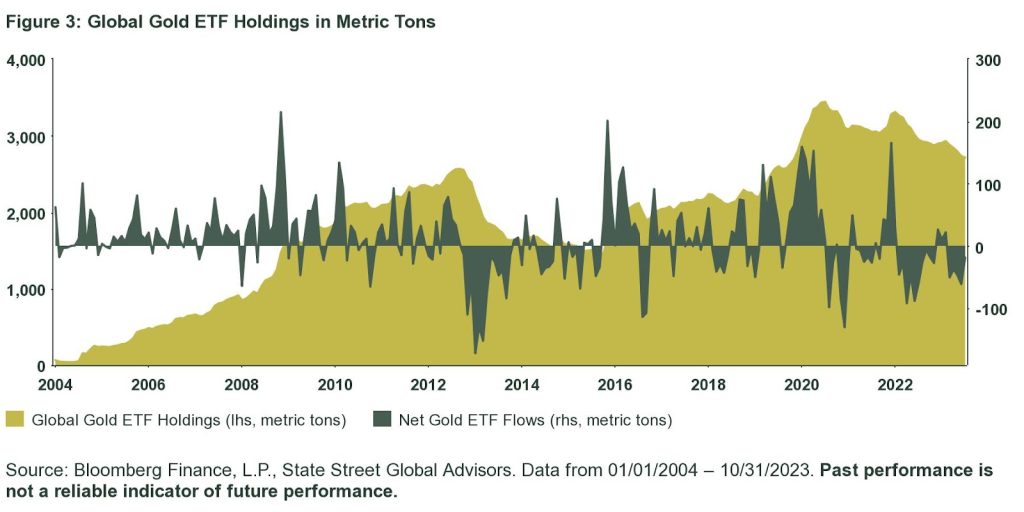
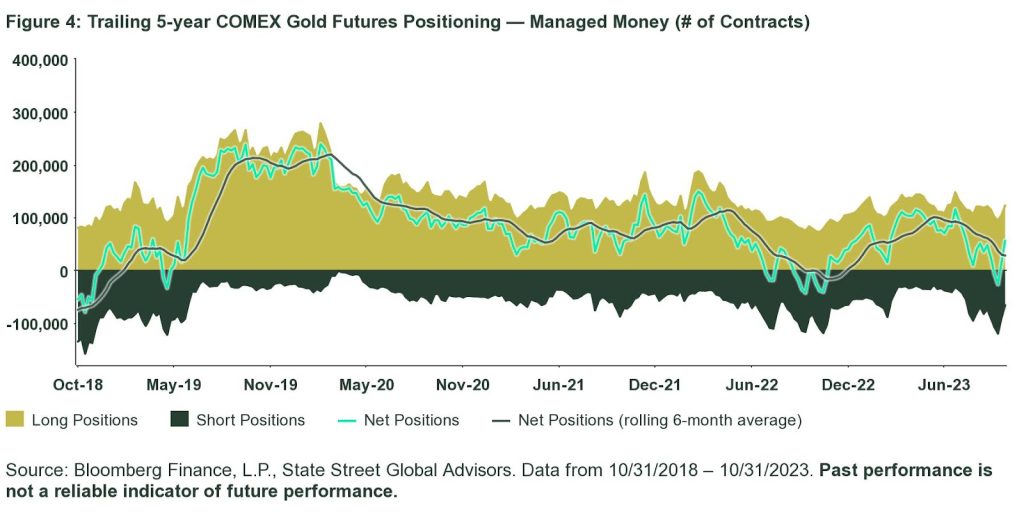
Global gold-backed ETFs registered outflows in October for the fifth consecutive month, albeit at a slower rate compared to the prior month. Global gold ETF holdings dropped 0.7% for the month, an estimated US$1.2B of net outflows versus US$3.4B outflows in September, according to Bloomberg data.4 COMEX Managed Money net speculative gold positions more than doubled to 55,748 contracts as of October 24, compared to 23,438 contracts in the month prior.5
Factors
The US dollar saw a slight increase of 0.46% in October, pushing the greenback’s year-to-date return to 3.03%, as both gold and the dollar saw increased flight-to-safety demand.6 US 10-Year Treasury yields closed October at 4.89%, rising 0.32% from 4.57% last month.7 Commensurately, the US 10-Year TIPS implied yield rose from 2.23% to 2.45% in October, as market risk and central bank buying continues to support gold against the traditional headwind of higher real yields.8
Fundamentals
Global gold demand in Q3 increased 15% from Q2 to 1,148 metric tons, while seeing a 6% drop on a year over year basis. Demand was led by significant central bank purchases, amounting to 337 metric tons in Q3. This was 2.5 times larger than the average quarterly central bank purchases since 2010, and brought year-to-date net central bank gold purchases to 800 metric tons.9
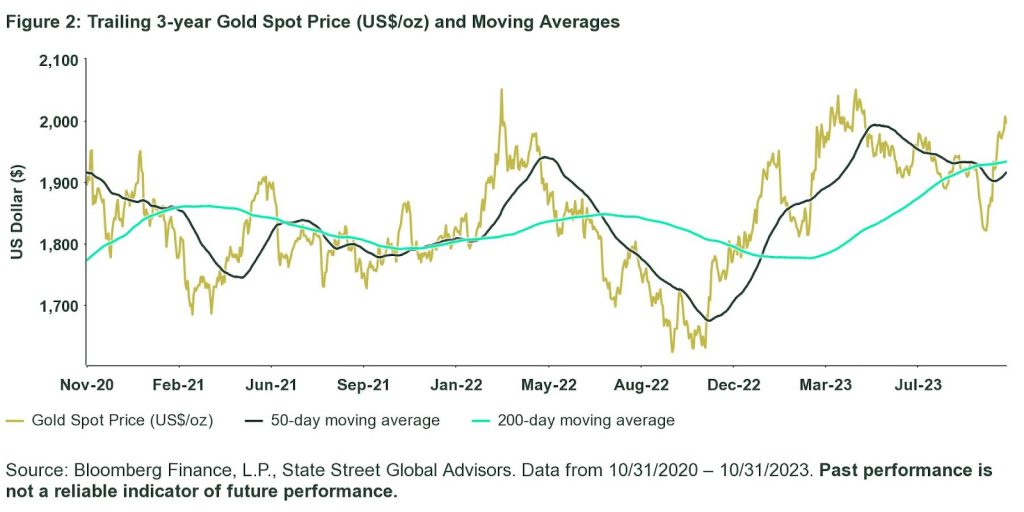
Gold Price Trends
Gold ETF Flows
Gold Futures
This post first appeared on November 7th, 2023 on the SSGA blog
PHOTO CREDIT: https://www.shutterstock.com/g/macrowildlife
Via SHUTTERSTOCK
Glossary
Bloomberg Commodity Total Return Index
A broadly diversified commodity price index distributed by Bloomberg Indexes that tracks 22 commodity futures and seven sectors. No one commodity can compose less than 2 percent or more than 15 percent of the index, and no sector can represent more than 33 percent of the index.
Bloomberg Global Aggregate Total Return Index
The Bloomberg Global Aggregate Index is a flagship measure of global investment grade debt from twenty-four local currency markets. This multi-currency benchmark includes treasury, government-related, corporate and securitized fixed-rate bonds from both developed and emerging markets issuers.
Consumer Price Inflation (CPI) Index
This CPI represents changes in prices of all goods and services purchased for consumption by urban households on a year-over-year basis.
Gold Spot Price
The price in spot markets for gold. In US dollar terms, spot gold is referred to with the symbol “XAU,” which refers to the price of one troy ounce of gold in USD terms.
Gross Domestic Product (GDP)
Gross domestic product is the monetary value of all finished goods and services made within a country during a specific period. GDP provides an economic snapshot of a country, used to estimate the size of an economy and its growth rate.
Silver Spot Price
The price in spot markets for silver. In US dollar terms, spot silver is referred to with the symbol “XAG,” which refers to the price of one troy ounce of silver in USD terms.
MSCI All Country World Index (ACWI)
Captures large and mid cap representation across 23 Developed Markets (DM) and 26 Emerging Markets (EM) countries. With 3,050 constituents, the index covers approximately 85% of the global investable equity opportunity set.
S&P 500 Index
A popular benchmark for US large-cap equities that includes 500 companies from leading industries and captures approximately 80% coverage of available market capitalization.
Troy ounce (oz)
Standard unit of measurement for weighing precious metals such as gold, silver, platinum, and palladium.
US Dollar Spot (DXY) Index
The DXY Dollar Index tracks the performance of a basket of foreign currencies issued by US major trade partners, including Eurozone, Japan, UK, Canada, Sweden and Switzerland, versus the US Dollar.
Footnotes
1 Bloomberg Finance L.P., State Street Global Advisors. Data as of October 31, 2023.
2 Bloomberg Finance L.P., State Street Global Advisors. Data as of October 31, 2023.
3 Bloomberg Finance L.P., State Street Global Advisors. Data as of October 31, 2023.
4 Bloomberg Finance L.P., State Street Global Advisors. Data as of October 31, 2023.
5 Bloomberg Finance L.P., State Street Global Advisors. Data as of October 31, 2023.
6 Bloomberg Finance L.P., State Street Global Advisors. Data as of October 31, 2023.
7 Bloomberg Finance L.P., State Street Global Advisors. Data as of October 31, 2023.
8 Bloomberg Finance L.P., State Street Global Advisors. Data as of October 31, 2023.
9 World Gold Council, State Street Global Advisors. Data as of September 30, 2023.
Disclosures
Important Risk Information
This communication is not intended to be an investment recommendation or investment advice and should not be relied upon as such.
The views expressed in this material are the views of the SPDR Gold Strategy Team through the period ended October 31, 2023 and are subject to change based on market and other conditions. This document contains certain statements that may be deemed forward looking statements. Please note that any such statements are not guarantees of any future performance and actual results or developments may differ materially from those projected.
The information provided does not constitute investment advice and it should not be relied on as such. It should not be considered a solicitation to buy or an offer to sell a security. It does not take into account any investor’s particular investment objectives, strategies, tax status or investment horizon. You should consult your tax and financial advisor.
The trademarks and service marks referenced herein are the property of their respective owners. Third party data providers make no warranties or representations of any kind relating to the accuracy, completeness or timeliness of the data and have no liability for damages of any kind relating to the use of such data.
The whole or any part of this work may not be reproduced, copied or transmitted or any of its contents disclosed to third parties without SSGA’s express written consent.
Commodities and commodity-index linked securities may be affected by changes in overall market movements, changes in interest rates, and other factors such as weather, disease, embargoes, or political and regulatory developments, as well as trading activity of speculators and arbitrageurs in the underlying commodities.
Investing in commodities entails significant risk and is not appropriate for all investors.
Diversification does not ensure a profit or guarantee against loss.
Past performance is not a reliable indicator of future performance.