

By: Kevin Flanagan, Head of Fixed Income Strategy
It’s 8:30 in the morning, and I’m trying to stay awake at my desk for my Econ 101 class. We take out our pens (yes, writing instruments from the 20th century) and are taught that two consecutive quarters of negative real GDP is the definition of a recession. Fast forward a few years later—okay, more than a “few”—and all of a sudden, the definition of an economic downturn is undergoing some sort of revision. Hence the question: when is a recession actually a recession?
The Bureau of Economic Analysis (BEA) weighed in on the discussion yet again last week with the release of the Third Estimate for Q2 2022 real GDP. Typically, the third release of this economic report doesn’t garner much attention, but for this report, the BEA incorporated their annual revisions to data dating from Q1 2017 through Q1 2022. Remember, in the original releases, the BEA reported that real GDP for both Q1 and Q2 of this year fell in the negative column, a development that gave rise to recession talk. In other words, one could say the U.S. economy entered into a “technical recession” during the first half of the year. For the record, that conclusion didn’t change one bit, as the negative readings for Q1 and Q2 went unrevised at -1.6% and -0.6%, respectively.
This is where the debate began as some Fed members and outside economists pushed back on this narrative, especially given the ongoing solid nature of the labor market. As a result, another gauge, gross domestic income (GDI), came into focus.
Average of Real GDP and GDI
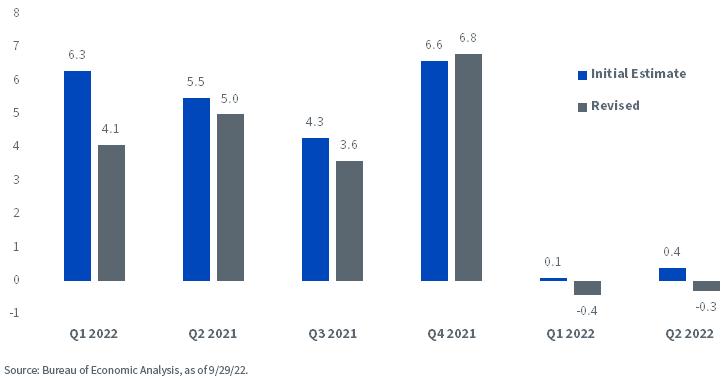
According to the BEA, GDI is defined as a measure of the incomes earned and the costs incurred in the production of gross domestic product and is another way of measuring economic activity. For the record, GDP measures the value of the final goods and services produced in the U.S. To sum up, GDP calculates economic activity by expenditures, while GDI focuses on the incomes generated during the process. Interestingly, the BEA states that both are “conceptually equal.” While each series can produce different short-term results, they tend to come together over the longer haul.
Another way of looking at economic activity is to average real GDP and GDI together, a component the BEA produces as well. As the bar chart reveals, this “average” did post positive readings in the BEA’s initial estimates, but after the annual revision process, it now resides in negative territory for both Q1 and Q2. So that begs the question: has the recession riddle finally been answered? Probably not, but the evidence for how the first half of this year played out certainly points in the “technical recession” direction.
Conclusion
I would agree that the real GDP data provided thus far is “yesterday’s news,” but knowing the starting point as the Fed continues to ramp up its rate hikes can be valuable information for where the U.S. economy may be headed. For the record, most forecasts for Q3 2022 seem to be leaning toward a return to slightly positive growth, with the Atlanta Fed GDPNOW forecast, as of this writing, looking for a +2.3% increase.
Originally Posted October 5th, 2022, WisdomTree Blog
PHOTO CREDIT: https://www.shutterstock.com/g/eamesBot
Via SHUTTERSTOCK
DISCLOSURE
Investing involves risk, including the possible loss of principal. Diversification does not ensure a profit nor guarantee against a loss.
This material represents an assessment of the market environment at a specific point in time and is not intended to be a forecast of future events, or a guarantee of future results. This information is not intended to be individual or personalized investment or tax advice and should not be used for trading purposes. Please consult a financial advisor or tax professional for more information regarding your investment and/or tax situation.


