By: Mark Barnes, PhD, and Christine Haggerty, Global Investment Research (GIR)
Following a decade of turbocharged outperformance in the early 2000s, emerging-market (EM) stocks have been mired in a protracted losing streak versus their developed-market peers.
The reasons behind this defeat are largely rooted in the profound compositional shifts that have transformed the EM universe over the past decade. While these changes helped drive EM outperformance in the boom years and have the potential to do so in the future, they have worked against the asset class since the outbreak of the Covid-19 pandemic in early 2020.
Three-year-rolling annualized index returns (%)
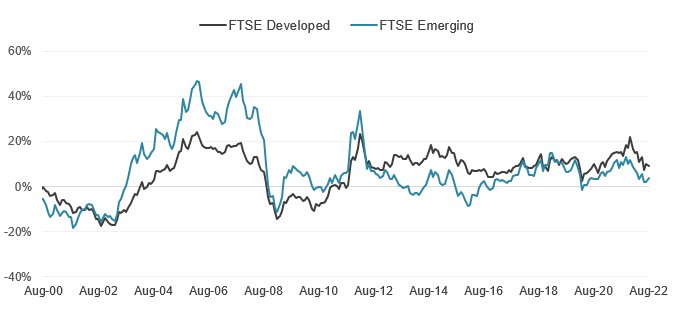
Source: FTSE Russell. Data through August 31, 2022. Past performance is no guarantee to future results. Please see the end for important disclosures.
As the table below shows, the FTSE Developed index posted an annualized return of 9.1% for the past three years ended August 31, 2022, more than twice the 3.8% gain of the FTSE Emerging index, despite slightly higher annualized volatility. The risk/return divergences between the two indexes is even more striking when viewed over the five- and 10-year periods.
Annualized returns and volatility (%) and return/risk ratios – through August 31, 2022
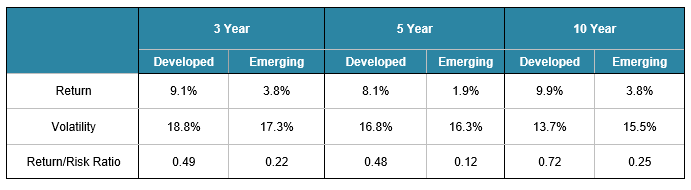
Source: FTSE Russell. Data through August 31, 2022. Past performance is no guarantee of future results. Please see the end for important legal disclosures.
EM investing enters a new era
Understanding this long stretch of underperformance (as well as the future of emerging-market investing) requires recognizing just how fundamentally the EM investment landscape has changed over the past decade. We would rank the inclusion of China into the EM index and the massive shift from resource-heavy sectors into technology and other “new economy” stocks as the most transformative.
The China Juggernaut
Much of the divergence between the developed and emerging indexes comes down to the dominance of their largest country markets – the US and China. While the size of the US in the developed index has expanded considerably (from 48% at year-end 2011 to 67% currently), China’s share in the EM index has doubled over that same period (from 17% to 35% today). That’s twice the weights of the next two largest EM country markets, India (at 17%) and Taiwan (at 16%). Nearly 55% of the total 1,893 companies in the FTSE Emerging index are China-based.
China’s ascendency has, in turn, greatly increased the prominence of emerging Asian markets (now a whopping three-fourths of the EM index), while diminishing the status of Latin America, to under 10% from 28% at year-end 2011.
Regional weights in the FTSE Emerging Index (%)
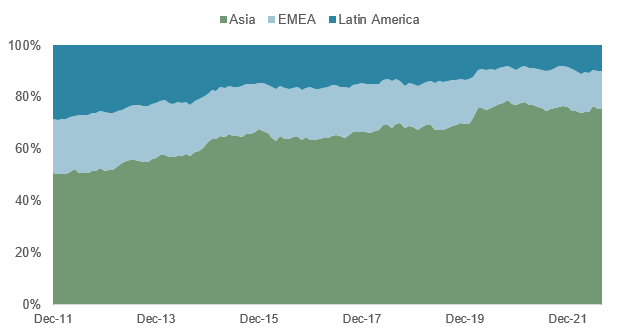
Source: FTSE Russell. Data through August 31, 2022. Past performance is no guarantee of future results. Please see the end for important legal disclosures.
The Tech Effect
A decade ago, EM investing was predominantly viewed as a resource-wealth play: Energy and basic materials stocks comprised a combined weight of 29% of the FTSE EM index at year-end 2011. Resource-rich Latin American exporters (led by Brazil), Russia and South Africa enjoyed rapid growth by feeding off of China’s breakneck industrialization and voracious appetite for energy, grains and industrial metals.
Over the past 10 years, however, resource companies have steadily lost supremacy. The emergence and phenomenal growth of the Internet, smartphones and home-grown Chinese e-commerce companies has catapulted the technology and consumer discretionary industries to a combined EM index weight of 36%, placing them alongside financials as the index’s largest industry exposures. As the chart below shows, the energy and materials weight has halved, to 14%.
More than half (13) of the 25 largest EM stocks by market capitalization are in technology or consumer discretionary, led by chip maker Taiwan Semiconductor and Chinese e-commerce titans, Tencent and Alibaba. The shift to tech has also been behind the rising influence of Asian markets in the EM index, as many of these countries have become major hubs for the manufacturing of technology components and other related products. Fifty-five percent of the 188 EM technology companies are China-based.
Over that same 10-year period, financials have maintained a relatively steady weight of around 20%.
Changes in FTSE Emerging Index industry weights (%) – Dec 2011 vs Aug 2022
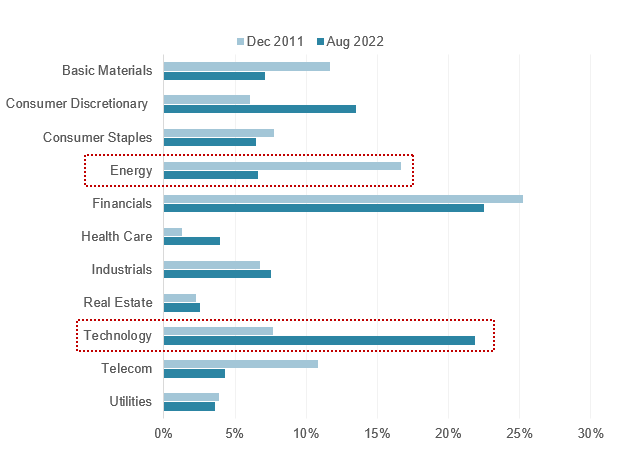
Source: FTSE Russell. Data as of August 31, 2022. Past performance is no guarantee of future results. Please see the end for important legal disclosures.
Pandemic headwinds
Both developed and developing equity markets have been grappling with the extreme economic dislocations, inflationary aftershocks and sharp swings in risk sentiment since the pandemic began. However, the crisis has been far more painful for EM stocks. The index badly lagged its developed counterpart in both the broad market collapse in early 2020 and the subsequent recoveries, though it has suffered less in this year’s global meltdown.
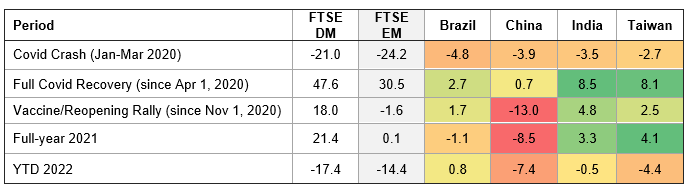
As highlighted in the heat map below, China has played an outsized role in this Covid-era underperformance. On a country-weighted basis, China has detracted 13 percentage points from total EM returns since the vaccine- and reopening-fueled rally began in November 2020, overpowering the positive contributions of the three next largest EM countries, particularly India and Taiwan. China was also by far the biggest drag on EM returns in 2021 (when most major equity markets posted strong gains) and has led EM losses this year.
Country-weighted contributions to FTSE Emerging Index returns (%) – through August 31, 2022
Source: FTSE Russell. Data as of August 31, 2022. Past performance is no guarantee of future results. Please see the end for important legal disclosures.
Much of China’s recent losing streak has stemmed from events specific to China. Legacy Covid-related disruptions, the lingering property-market debt crisis and the government’s zero-Covid policy restrictions have led to a much deeper-than-expected slowing in the country’s economy. Though the macro backdrop has improved somewhat as Covid restrictions have eased and stimulus measures have kicked in, the economic outlook remains dim.
The EM index’s large exposure of this year’s carnage in tech and other high-growth stocks globally and in China (exacerbated by the government’s regulatory crackdown on its domestic tech industry since 2020), as well as its reduced exposure to the recent outperformance of energy and other natural resource stocks, have also hurt relative performance.
Going forward, China and tech stocks will likely continue to have a huge influence on which way the wind blows for emerging-market stocks.
Originally Posted September 26th, 2022, FTSE Russell Blog
PHOTO CREDIT: https://www.shutterstock.com/g/photonphoto
Via SHUTTERSTOCK
Investors cannot invest directly in indexes. The FTSE Developed Index is a market-capitalization weighted index representing the performance of large and mid cap companies in Developed markets. The FTSE Emerging Index provides investors with a comprehensive means of measuring the performance of the most liquid large- and mid-cap companies in the emerging markets.
© 2022 London Stock Exchange Group plc and its applicable group undertakings (the “LSE Group”). The LSE Group includes (1) FTSE International Limited (“FTSE”), (2) Frank Russell Company (“Russell”), (3) FTSE Global Debt Capital Markets Inc. and FTSE Global Debt Capital Markets Limited (together, “FTSE Canada”), (4) FTSE Fixed Income Europe Limited (“FTSE FI Europe”), (5) FTSE Fixed Income LLC (“FTSE FI”), (6) The Yield Book Inc (“YB”) and (7) Beyond Ratings S.A.S. (“BR”). All rights reserved.
FTSE Russell® is a trading name of FTSE, Russell, FTSE Canada, FTSE FI, FTSE FI Europe, YB and BR. “FTSE®”, “Russell®”, “FTSE Russell®”, “FTSE4Good®”, “ICB®”, “The Yield Book®”, “Beyond Ratings®” and all other trademarks and service marks used herein (whether registered or unregistered) are trademarks and/or service marks owned or licensed by the applicable member of the LSE Group or their respective licensors and are owned, or used under license, by FTSE, Russell, FTSE Canada, FTSE FI, FTSE FI Europe, YB or BR. FTSE International Limited is authorized and regulated by the Financial Conduct Authority as a benchmark administrator.
All information is provided for information purposes only. All information and data contained in this publication is obtained by the LSE Group, from sources believed by it to be accurate and reliable. Because of the possibility of human and mechanical error as well as other factors, however, such information and data is provided “as is” without warranty of any kind. No member of the LSE Group nor their respective directors, officers, employees, partners or licensors make any claim, prediction, warranty or representation whatsoever, expressly or impliedly, either as to the accuracy, timeliness, completeness, merchantability of any information or of results to be obtained from the use of FTSE Russell products, including but not limited to indexes, data and analytics, or the fitness or suitability of the FTSE Russell products for any particular purpose to which they might be put. Any representation of historical data accessible through FTSE Russell products is provided for information purposes only and is not a reliable indicator of future performance.
No responsibility or liability can be accepted by any member of the LSE Group nor their respective directors, officers, employees, partners or licensors for (a) any loss or damage in whole or in part caused by, resulting from, or relating to any error (negligent or otherwise) or other circumstance involved in procuring, collecting, compiling, interpreting, analyzing, editing, transcribing, transmitting, communicating or delivering any such information or data or from use of this document or links to this document or (b) any direct, indirect, special, consequential or incidental damages whatsoever, even if any member of the LSE Group is advised in advance of the possibility of such damages, resulting from the use of, or inability to use, such information.
No member of the LSE Group nor their respective directors, officers, employees, partners or licensors provide investment advice and nothing in this document should be taken as constituting financial or investment advice. No member of the LSE Group nor their respective directors, officers, employees, partners or licensors make any representation regarding the advisability of investing in any asset or whether such investment creates any legal or compliance risks for the investor. A decision to invest in any such asset should not be made in reliance on any information herein. Indexes cannot be invested in directly. Inclusion of an asset in an index is not a recommendation to buy, sell or hold that asset nor confirmation that any particular investor may lawfully buy, sell or hold the asset or an index containing the asset. The general information contained in this publication should not be acted upon without obtaining specific legal, tax, and investment advice from a licensed professional.
Past performance is no guarantee of future results. Charts and graphs are provided for illustrative purposes only. Index returns shown may not represent the results of the actual trading of investable assets. Certain returns shown may reflect back-tested performance. All performance presented prior to the index inception date is back-tested performance. Back-tested performance is not actual performance, but is hypothetical. The back-test calculations are based on the same methodology that was in effect when the index was officially launched. However, back-tested data may reflect the application of the index methodology with the benefit of hindsight, and the historic calculations of an index may change from month to month based on revisions to the underlying economic data used in the calculation of the index.
This document may contain forward-looking assessments. These are based upon a number of assumptions concerning future conditions that ultimately may prove to be inaccurate. Such forward-looking assessments are subject to risks and uncertainties and may be affected by various factors that may cause actual results to differ materially. No member of the LSE Group nor their licensors assume any duty to and do not undertake to update forward-looking assessments.
No part of this information may be reproduced, stored in a retrieval system or transmitted in any form or by any means, electronic, mechanical, photocopying, recording or otherwise, without prior written permission of the applicable member of the LSE Group. Use and distribution of the LSE Group data requires a license from FTSE, Russell, FTSE Canada, FTSE FI, FTSE FI Europe, YB, BR and/or their respective licensors.