By Jeremy Schwartz, CFA, Global Head of Research
The team at GMO recently came out with their mid-year investor letter and one chart raised some alarm bells.
In the chart below, we see that in the seven years ending March 2000, earnings forecasts were growing at a very healthy clip—over 11% per year. The issue was that excitement for technology stocks was so high that prices grew 69% faster.
In the seven years ending March 2021, prices have now grown 70% more than earnings forecasts.
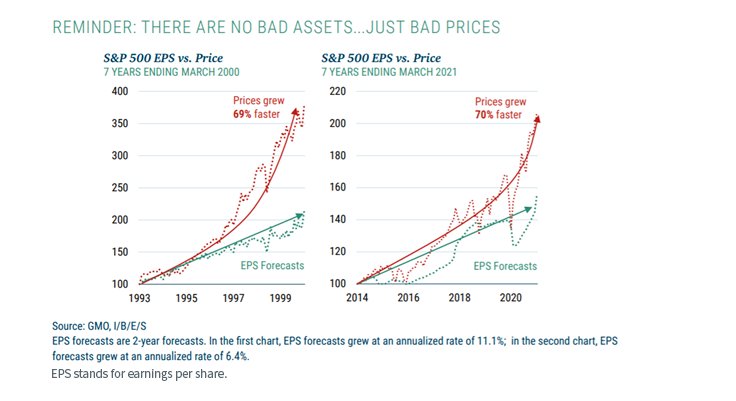
These rising price levels are symbolic of more elevated market valuations—which gets magnified in market capitalization-weighted indexes that lean heavier into stocks that are already rising the most.
Reconnecting Stocks with their Earnings
In February 2007, WisdomTree launched a suite of earnings-weighted stock indexes that reconnects stock allocations to their underlying earnings. The valuation discounts we see today in this earnings-weighted family are some of the widest gaps compared to their market cap-weighted counterparts that we’ve seen since inception.
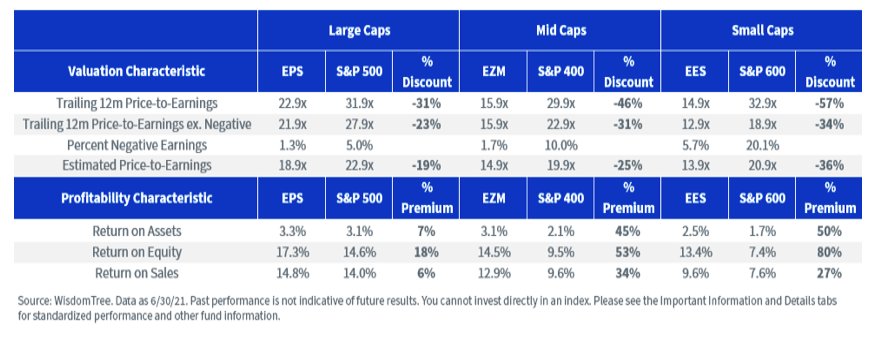
Using trailing earnings, which makes the market look more expensive, the valuation gaps for WisdomTree’s earnings-weighted strategies compared to the S&P family of market cap-weighted benchmarks, ranges from 31% for large capsto 57% for small caps.
Using estimated earnings for 2021, the valuations look more reasonable for the cap-weighted market: around 23 times for S&P 500 and 20–21 times for mid and small caps.
Junkier Stocks
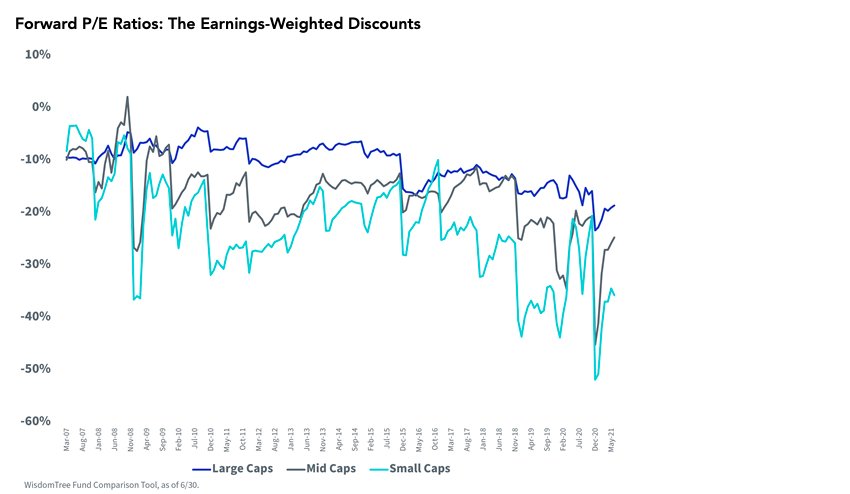
The discount for WisdomTree’s earnings-weighted strategies using forward-looking earnings ranges from 19% for large caps to 36% for small caps.
Often, one assumes you sacrifice quality and profitability and get ‘junkier’ stocks when you look for valuation discounts. But the earnings-weighted approach and additional risk screens we added to our Indexes have led to profitability premiums across all size segments. You can see this in profit margins (return on sales), ROE or ROAmetrics.
In the below tables, we compare the WisdomTree U.S. LargeCap Fund (EPS), WisdomTree U.S. MidCap Fund (EZM) and WisdomTree U.S. SmallCap Fund (EES) relative to their corresponding market cap-weighted Indexes, based on size.
For standardized performance of the Funds in the table, please click their respective ticker: EPS, EZM, EES.
For definitions of terms in the table, please visit the glossary.
Forward P/E Ratios: The Earnings-Weighted Discounts
Takeaway
The more market valuations rise, the more important we believe it is to reconnect stock weights with their underlying earnings. As investors talk more about the value rotation, WisdomTree’s family provides very broad-based diversified exposure to these size segments, without having specific valuation cutoffs to sort the market and only select a subset of the market.
These Indexes start with all profitable companies in their universes, and then weight those companies by their core earnings streams and make adjustments for the most risky stocks in their universe. Now could be a particularly good time for both elements of this lower valuation and risk-controlled process.
This post originally appeared on August 13 on the WisdomTree blog.
Photo Credit: thenails via Flickr Creative Commons
DISCLOSURE
There are risks associated with investing, including the possible loss of principal. Funds focusing their investments on certain sectors and/or smaller companies increase their vulnerability to any single economic or regulatory development. This may result in greater share price volatility. Please read each Fund’s prospectus for specific details regarding the Fund’s risk profile.
The Standard and Poor’s 500, or simply the S&P 500, is a stock market index tracking the performance of 500 large companies listed on stock exchanges in the United States. Investors can’t invest directly in indexes.