

By Matthew J Bartolini, CFA,Head of SPDR Americas Research
With our inability to prune the latest COVID variant from the market’s recovery timeline, we have entered a new branch of the reopening — oscillating between a return to normalcy and relapse. This has led to more frequent gyrations among style returns, with leadership becoming less persistent and more volatile.
With such variability between pro-cyclical (reopening stocks) and secular (high growth) exposures, investors have been left to decide which market style exposure to invest in — creating more uncertainty in an already uncertain world.
In this Charting the Market, I illustrate how volatile leadership has become, and what solutions investors may want to consider when navigating the increased choppiness of returns.
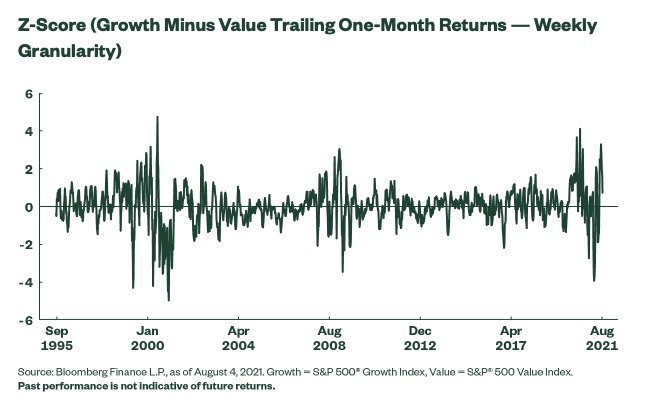
Growth. Now Value. Now Growth. Now Value.
In June, growth was underperforming value by 5% over the prior four weeks (i.e., rolling one-month returns), a two standard deviation event. Fast forward one month, and growth was outperforming value by 10% in the middle of July — a more than three standard deviation event. As of the end of July, growth’s outperformance did decline (+5% versus value in the prior four weeks), but was still above one standard deviation, as shown below.
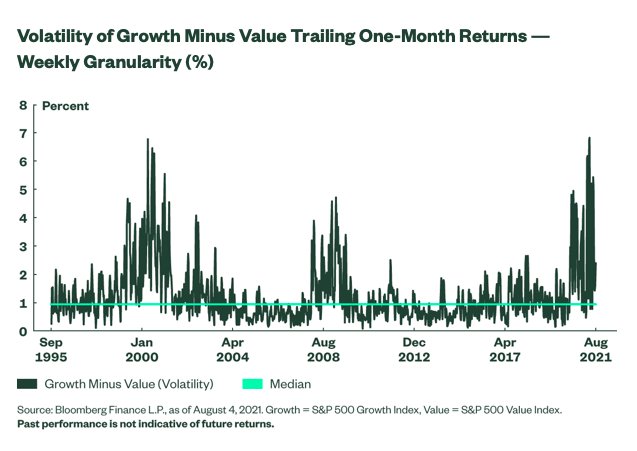
This flip-flop nature of style market leadership is also evident when analyzing the volatility of the excess returns between growth and value. As shown below, the standard deviation of the trailing one-month excess returns has been severely elevated of late, peaking in April 2021. It has been well above levels witnessed at the onset of the pandemic and beyond prior peaks (dot-com bubble). In fact, there have only been a few weekly observations in 2021 that have registered below the long-term historical median. As a result, the average volatility level has been 3.0% in 2021, 90, 110, and 30 percentage points more than the average volatility in 2020, 2008/2009, and 1999/2000, respectively.
Limited Winning Streaks
There is more evidence of style returns not following a specific trending pattern. On average, over the last 30 years, there has been at least one period in every calendar year where either growth or value has gone on an extended winning streak in relation to the other style, as defined by ten consecutive weeks of outperforming rolling one-month returns.
In 2021, however, there has been no such streak. This reinforces the lack of persistency of a particular style as the market lacks clear direction amid concerns over the vibrancy of the recovery, as we witness yet another rise in cases and mobility restrictions alongside uneven economic data.2 Until there is clear evidence of the direction of the recovery, this current trend is likely to persist.
To read this post in its entirety, please click here and visit the State Street Global Advisors blog.
Photo Credit: XXX via Flickr Creative Commons.
Footnotes
1Bloomberg Finance L.P., as of August 4, 2021. Growth = S&P 500 Growth Index; Value = S&P 500 Value Index.
2US Q2 GDP missed expectations while August Payrolls report beat expectations for example.
DISCLOSURE
The views expressed in this material are the views of SPDR Americas Research Team and are subject to change based on market and other conditions. This document contains certain statements that may be deemed forward-looking statements. Please note that any such statements are not guarantees of any future performance and actual results or developments may differ materially from those projected.
The information provided does not constitute investment advice and it should not be relied on as such. It should not be considered a solicitation to buy or an offer to sell a security. It does not take into account any investor’s particular investment objectives, strategies, tax status or investment horizon. You should consult your tax and financial advisor.
All material has been obtained from sources believed to be reliable. There is no representation or warranty as to the accuracy of the information and State Street shall have no liability for decisions based on such information.
All the index performance results referred to are provided exclusively for comparison purposes only. It should not be assumed that they represent the performance of any particular investment.
The Standard and Poor’s 500, or simply the S&P 500, is a stock market index that tracks 500 large companies listed on stock exchanges in the United States.The S&P Growth Index measures growth stocks using three factors: sales growth, the ratio of earnings change to price, and momentum. The S&P Value Index measures value stocks using three factors: the ratios of book value, earnings, and sales to price. Investors can’t invest directly into indexes.
The value style of investing that emphasizes undervalued companies with characteristics for improved valuations, which may never improve and may actually have lower returns than other styles of investing or the overall stock market.
The market values of growth stocks may be more volatile than other types of investments. The prices of growth stocks tend to reflect future expectations, and when those expectations change or are not met, share prices generally fall. The returns on “growth” securities may or may not move in tandem with the returns on other styles of investing or the overall stock market.


