

By Matthew J Bartolini, CFA, Head of SPDR Americas Research
Train Kept A-Rollin’ is an iconic rock-and-roll song, popularized by the up-tempo, but still blues-rock, style of Aerosmith — leading it to become a staple of the classic rock genre. Yet, it was first recorded by the jazz and rhythm and blues musician Tiny Bradshaw in 1951, and later updated/adapted to the more blues-rock feel we now know by the Yardbirds and Led Zeppelin in the late 1960’s. No matter which version is labeled as the best rendition, the blues-rock hit is still reflective of the current market environment.
Throughout the five minute and twenty-three second Aerosmith version from their “Get Your Wings” album, the narrative arc juxtaposed against Joe Perry’s blues riffs is a tale of power and endurance. And the same commentary can be made about the market’s recent rally. Over 75% of global equities are now trading above their 200-day moving average and 83% of stocks have posted gains (+35% average gain) since October, when the rally began in earnest given the presence of a vaccine timeline.1
Getting more granular, higher-risk stocks, as measured by high-beta names, have outperformed the market and their low volatility counterparts by 45% and 56% respectively since the end of October, posting a return of 74%.2 Additionally, the more risk-on, cyclical value and small-cap names have posted 55% and 48% returns since then — figures well above broad US large-caps.3
Earnings results have also come in stronger than expected, illustrating the power of the recovery. In the US, 84% of firms are surprising to the upside, well above the five-year average of 64%. And the magnitude of surprises is 26%. This high level of surprises has pushed year-over-year EPS growth to 49.8%.4 Outside of the US, 72% of European firms have beaten expectations by 32% — pushing Q1 growth to a staggering 80% on a year-over-year basis.5
Economic data is also showing power and endurance, evidenced by the fact the US economy has expanded for three straight quarters and accelerated in the first quarter when a rush of consumer spending helped bring total output near pre-pandemic levels. And personal consumption, the biggest part of the economy, surged by the second fastest rate since the 1960’s in the recent quarter.6
In Europe, while gross domestic product dipped in Q1, euro-area unemployment improved in March. And the outlook has started to brighten as vaccine rates begin to pick up and economies more fully re-open. There is also the potential boost on the horizon from the $968 billion fiscal stimulus package set to be deployed to the area.7
With this level of positivity, it is clear that following a once-in-a-lifetime crisis, the global economy continues to stage a once-in-a-lifetime recovery. From a business cycle perspective, the US has already started to move from recovery to expansion.8 And like the buds on flowers starting to open to the warmth of sunlight, business, storefronts, restaurants, hotels, and event locations are all starting to increase capacity and re-open their doors to society — evidenced by US mobility approaching its post-pandemic highs.9
A Rising Tide Lifts All Boats
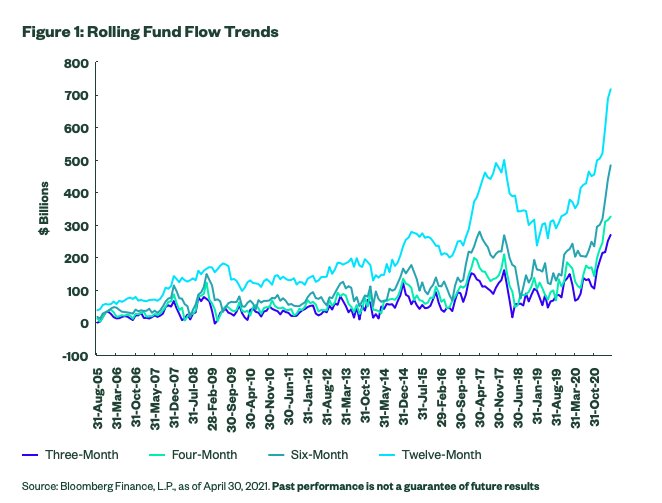
US-listed ETFs have been on a roll for the past six months, taking in $482 billion since the end of October — with $325 billion amassed in the first four months of 2021 alone. ETFs are on the greatest three-, four-, six-, and twelve-month rolls ever, as shown below. On a six-month basis, the $482 billion is four times the typical average. These records indicate that, with markets rolling to a 30% return since October, capital has been deployed at a frenetic pace as investors seek to participate in the recovery rally.
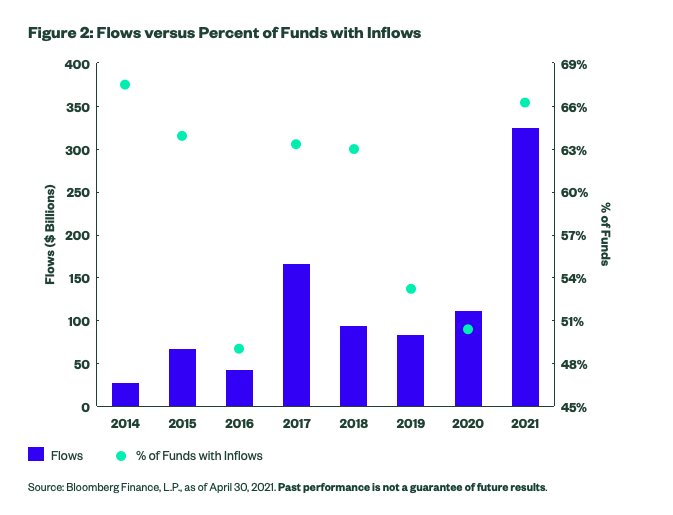
While the pace is strong, so is the depth. Through the end of April, the $325 billion of inflows year-to-date is being supported by the fact that 66% of all funds are in net inflows, as shown in Figure 2. This is the highest hit rate through April 30th in any given year since 2014, when a much smaller industry saw 67% of funds post inflows. If compared to a full year’s worth of results, the 66% is also the highest since 2017, when 69% of funds ended in net inflows for the full year. Interestingly enough, when flows hit records last year, only 65% of funds had net inflows for all of 2020 — illustrating how the capital being put to work in 2021 has more depth.
US Has the Most, but Overseas Trends Are Emerging
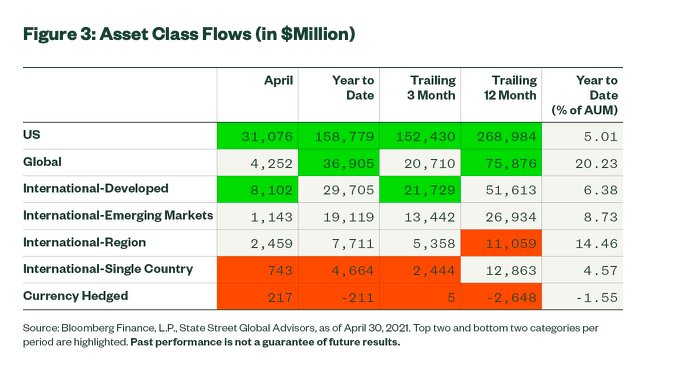
Like prior months, the higher-than-normal flows were led by risk-on equity ETFs and continue to paint a cyclically oriented bullish positioning picture. Equity ETFs took in $49 billion in April, their eighth highest ever, following back-to-back record hauls in February and March. US equity ETFs have taken in the highest flows over all considered time periods as shown below, but on a relative basis other regions have taken in more. The strong flows into regional ETFs were fueled by $2.2 billion of inflows into strategies exposed to European equities — potential a non-stretched regional re-open play as valuations have remained attractive for European equities and a recent rebound in earnings sentiment suggests an improving outlook. Further, the region is poised to benefit from re-opening momentum as the pace of vaccine rollouts increases and mobility restrictions are eased.
Cyclicals Still in Favor
Sector funds posted inflows once again last month, their seventh in a row and evidence of investors seeking more than just plain beta to participate in a rally that has featured clear breakaway winners, given that sector dispersion is in the 99th percentile.10 The flows were also once again heavily skewed towards cyclical segments, such as Financials (+$ 2 billion), Materials (+$1.8 billion), Energy (+$1.5 billion), and Real Estate ($1.3 billion). Overall, cyclicals outpaced defensives by $8 billion in April — their seventh month in a row of doing so and have now out-earned defensives by $40 billion over those months.
This article first appeared on May 5 on the State Street Global Advisors SPDR blog. To read the post in its entirety, please click here.
Photo Credit: thenails via Flickr Creative Commons
Footnotes
1 Bloomberg Finance, L.P., as of April 30, 2021. Based on the MSCI ACWI Index.
2 Bloomberg Finance, L.P., as of April 30, 2021. Based on the S&P 500® High Beta Index, S&P 500® Index, and S&P® 500 Low Volatility Index.
3 Bloomberg Finance, L.P., as of April 30, 2021. Based on the Russell 2000 Index and the S&P 500® Pure Value Index.
4 Bloomberg Finance, L.P., Barclays, as of April 30, 2021.
5 Bloomberg Finance, L.P., Barclays, as of April 30, 2021.
6 “U.S. Recovery Gain Steam as Spending Fuels 6.4% GDP Growth,” Bloomberg, April 29, 2021.
7 “Europe Is Casting Aside Double-Dip Slump as Growth Restarts,” May 3, 2021.
8 Bloomberg Finance, L.P. and SPDR Americas Research based on the Leading Economic Indicators Index, as of April 30, 2021.
9 Google Mobility Trends.
Disclosures
The views expressed in this material are the views of the SPDR Research and Strategy team and are subject to change based on market and other conditions. It should not be considered a solicitation to buy or an offer to sell any security. It does not take into account any investor’s particular investment objectives, strategies, tax status or investment horizon. There is no representation or warranty as to the current accuracy of such information, nor liability for decisions based on such information. Past performance is no guarantee of future results.
Unless otherwise noted, all data and statistical information were obtained from Bloomberg LP and SSGA as of April 30, 2021. Data in tables have been rounded to whole numbers, except for percentages, which have been rounded to the nearest tenth of a percent.
The research and analysis included in this document have been produced by SSGA for its own investment management activities and are made available here incidentally. Information obtained from external sources is believed to be reliable and is as of the date of publication but is subject to change. This information must not be used in any jurisdiction where prohibited by law and must not be used in a way that would be contrary to local law or legislation. No investment advice, tax advice, or legal advice is provided herein.
Investing involves risk including the risk of loss of principal.
Bonds generally present less short-term risk and volatility than stocks, but contain interest rate risk (as interest rates rise, bond prices usually fall); issuer default risk; issuer credit risk; liquidity risk; and inflation risk. These effects are usually pronounced for longer-term securities. Any fixed income security sold or redeemed prior to maturity may be subject to a substantial gain or loss.
Equity securities may fluctuate in value in response to the activities of individual companies and general market and economic conditions.
Concentrated investments in a particular sector or industry tend to be more volatile than the overall market and increases risk that events negatively affecting such sectors or industries could reduce returns, potentially causing the value of the Fund’s shares to decrease.
The whole or any part of this work may not be reproduced, copied or transmitted or any of its contents disclosed to third parties without SSGA’s express written consent.


