

By Steve Sosnick, Chief Strategist at Interactive Brokers
So far, those of you who followed the market adage “Sell in May and Go Away” are enjoying that decision. The graph below shows the performance of four major market indices over the month of May so far. Spoiler alert, all are lower:
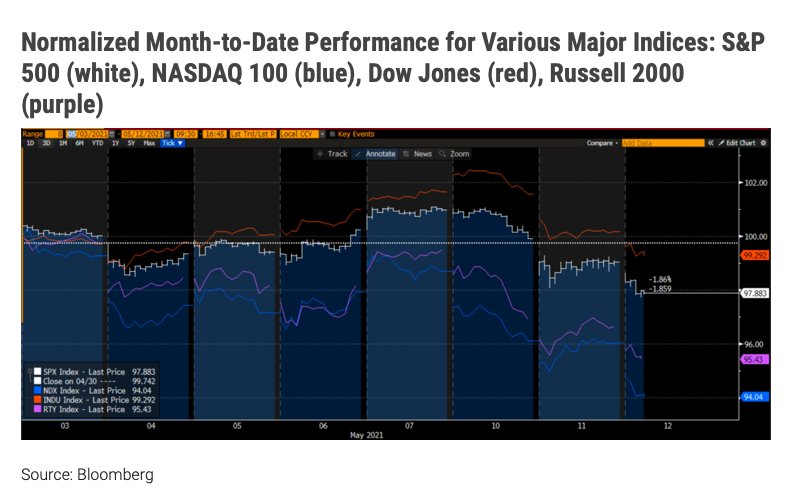
Source: Bloomberg
To be fair, the degree to which the “sell in May” strategy has been effective varies among the benchmark of your choice. The tech-heavy NASDAQ 100 (NDX) and small-cap focused Russell 2000 (RTY) have been lower all month and are performing worse. The more industrial-focused Dow Jones (INDU) and S&P 500 (SPX) performed well last week, only to pull back in recent sessions. Before today’s CPI induced sell-off, INDU was actually up for the month and SPX was only down marginally.
Inflation fears have gotten most of the blame for the recent dips in the broader market and credit for the rotation that have boosted stocks and sectors that benefit from higher prices in raw materials. We had been addressing investors’ inflation fears over the past week, (this piece discusses the topic and links to prior discussions) prior to this morning’s stunning inflation report. We saw headline CPI rise 0.8% vs an expectation of 0.2%, with the core rate rising 0.9% vs 0.3% expected. This put the year-over-year rise in CPI at 4.2%, well above the Federal Reserve’s 2% target.
The immediate reaction from my wife summed it up well “This is a surprise? Has anyone been to a store recently?” But the immediate reaction from equity and bond futures showed that it was indeed a surprise. Both fell sharply when the numbers were released, and they have continued to fall throughout the session (by the time of this writing). Inflationary fears in richly valued markets can create a nasty feedback cycle. Higher inflation expectations boost bond yields (lowering bond prices), which tend to hurt stock prices because they lower the discounted future cash flows of companies, particularly those with premium valuations.
While I don’t dispute the rationale that investors might be reacting normally to inflationary jitters, I believe that there may be another reason for the weakness that we are seeing this week – taxes. Don’t forget that the Biden administration pushed this year’s income tax filing deadline from April 15thto May 17th. Because May 17th is this coming Monday, today is the final day for investors who sell shares for regular delivery (T+2) to receive the proceeds in their accounts prior to tax day. We have been raising the specter of tax day since February, even before the normal deadline was extended. Our rationale was this: we saw a huge influx of new investors in equity markets during 2020. Most of them began buying stocks after the washout in February-March. That means that many of those investors are sitting on gains. Furthermore, much of the new investor activity was speculative in nature. Successful traders with short holding periods would have found themselves with taxable gains in 2020 that need to be paid by Monday. It would be logical to expect that successful traders would have kept most of their money invested in stocks. That would have been a wise move, since the indices in the chart above are still showing substantial gains during 2021 despite the recent slippage.
Let’s do the math, shall we? If a large group of investors is sitting on substantial tax liabilities yet is fully invested, how will they pay when the bill is due? They will be forced to sell some of their holdings to raise the necessary cash. If enough investors find themselves in a cash crunch in the week before taxes are due, their selling would have almost certainly provided a downward bias to popular indices even if the news flow was neutral.
If that logic holds, it is possible that today’s move could become a short-term selling climax. I had expressed some concern that there would be some short-term outflows simply for tax reasons, but now the news flows may be dictating a larger sentiment change at work.
If that is the case, we may be moving on from basic seasonality and tax flows into a more meaningful set of trend changes. In the meantime, the message for the tax-related sellers is one they likely heard from parents and teachers when they were children – don’t wait until the last minute!
This post first appeared on May 12 on the Traders’ Insight blog
Photo Credit: the nails via Flickr Creative Commons
DISCLOSURE: INTERACTIVE BROKERS
The analysis in this material is provided for information only and is not and should not be construed as an offer to sell or the solicitation of an offer to buy any security. To the extent that this material discusses general market activity, industry or sector trends or other broad-based economic or political conditions, it should not be construed as research or investment advice. To the extent that it includes references to specific securities, commodities, currencies, or other instruments, those references do not constitute a recommendation by IBKR to buy, sell or hold such investments. This material does not and is not intended to take into account the particular financial conditions, investment objectives or requirements of individual customers. Before acting on this material, you should consider whether it is suitable for your particular circumstances and, as necessary, seek professional advice.
DISCLOSURE: TAX-RELATED ITEMS (CIRCULAR 230 NOTICE)
The information in this material is provided for informational purposes only and does not constitute tax advice and cannot be used by the recipient or any other taxpayer to avoid penalties under any federal, state, local or other tax statutes or regulations, or to resolve any tax issue.
DISCLOSURE: FUTURES TRADING
Futures are not suitable for all investors. The amount you may lose may be greater than your initial investment. Before trading futures, please read the CFTC Risk Disclosure. A copy and additional information are available at ibkr.com.
The Standard and Poor’s 500, or simply the S&P 500, is a free-float weighted measurement stock market index of 500 of the largest companies listed on stock exchanges in the United States. The Dow Jones Industrial Average, Dow Jones, or simply the Dow, is a stock market index that measures the stock performance of 30 large companies listed on stock exchanges in the United States. The Nasdaq-100 is a stock market index made up of 102 equity securities issued by 100 of the largest non-financial companies listed on the Nasdaq stock market.The Russell 2000 Index is a small-cap stock market index of the smallest 2,000 stocks in the Russell 3000 Index. It was started by the Frank Russell Company in 1984. The index is maintained by FTSE Russell, a subsidiary of the London Stock Exchange Group. Investors can’t invest directly into indexes.
.


