By Jaakko Kooroshy, head, SI data and methodologies, and Felix Fouret, senior SI analyst
With the COP26 climate summit in Glasgow less than 200 days away, countries accounting for more than two-thirds of global GDP have now committed to net-zero emissions by the middle of the century. Over half of the 167 world’s largest, systemically important corporate emitters have made similar “net-zero” commitments according to Climate Action 100+, an initiative backed by over 500 investors that jointly represent over $50 trillion in assets under management.
This is stunning change compared to the last “big” COP in Paris six years ago, when few companies were willing to make any promises to reduce their absolute volume of annual greenhouse gas (GHG) emissions—let alone publicly commit to concrete timelines for ceasing such emissions altogether.[1] It’s the remarkable result of concerted efforts from campaigners, governments and investors to convince industries that are at the heart of the problem to become a part of the solution.
Big Pledges
Implicit in these net-zero pledges is the commitment from these corporate behemoths—whose combined market capitalization of $4.5 trillion is bigger than the GDP of Germany—to embark on a difficult journey to fundamentally transform their businesses over the relatively short time span of a few decades.
The challenges—and risks—in this transition are enormous. Building a business model that is fit for the low-carbon economy is a tough ask if carbon-intensive activities are hardwired into your organizational DNA. For many of the companies covered by Climate Action 100+, this will require winding down profitable core activities and replacing them with revenue streams from entirely new products and services. In many cases, this will involve huge bets on technologies that don’t yet exist (think zero-emission steel, cement or containerships).
The investors behind Climate Action 100+ are keenly aware of these challenges, but they also understand that there are few viable alternatives. For the largest corporate emitters, decarbonizing early and rapidly is the best shot at successfully navigating an accelerating low-carbon transition that poses existential risks. At the same time, their decarbonization would represent a critical contribution to the global effort of avoiding the worst impacts of climate change, including potentially debilitating, portfolio-wide ramifications for investors.
Sceptics may wonder whether the raft of net-zero commitments from large emitters genuinely expresses an ambition for such transformative change, or whether they are just the latest incarnation of corporate greenwash in service of business as usual.
This is a question that is surprisingly hard to answer. In the run-up to COP, investors have been faced with a blizzard of net-zero commitments, targets and pledges, with little standardization or consistency.
Data Gathering
To help meet this challenge, Climate Action 100+ coordinated a year-long, major research and data gathering exercise involving experts from the Principles for Responsible Investment (PRI), the regional climate investor networks (Ceres, IIGCC, AIGCC and IGCC) EY, the Transition Pathway Initiative, the Grantham Institute at the London School of Economics, FTSE Russell, Carbon Tracker, 2° Investing Initiative and InfluenceMap.
Last month, these efforts culminated in the launch of the first CA100+ Net-Zero Company Benchmark, which systematically assesses the climate ambitions and actions of 159 of the corporate carbon emitters targeted by the initiative.[2] At the heart of the assessment are nine key indicators that have been assessed by the Transition Pathway Initiative and FTSE Russell. These cover emissions targets (1-4); the decarbonization strategy to meet these targets, including green revenues (5); the alignment of capital expenditures (6); climate lobbying (7); climate governance (8); and alignment with the recommendations of the Task Force on Climate-related Financial Disclosures (TCFD) (9).[3]
The headline results of the assessment are sobering. While over 50% of the assessed companies have now committed to reach net zero by 2050, only around half of those commitments fully cover the companies’ most material emissions; and fewer companies yet are willing to set interim targets for investors to track in the near and medium term. Details on how companies are planning to meet these targets, or clear commitments to align capital expenditures with decarbonization plans, are still the exception rather than the rule.
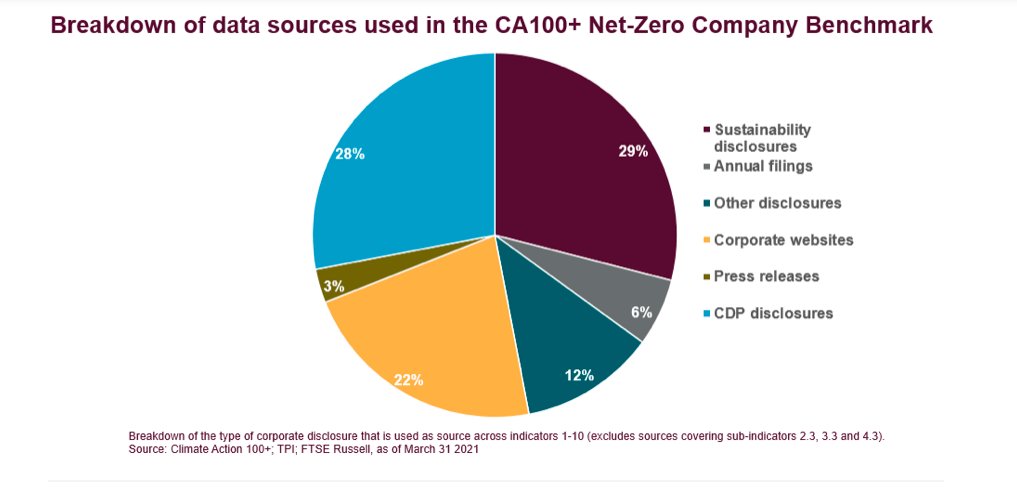
It is also clear that conducting this exercise is much harder than it should be. Four years after the release of the TCFD recommendations, still no two sets of climate disclosures look alike. Concise, plain-language climate commitments as part of annual filings remain a rare find. Instead, getting to the bottom of a company’s climate position often requires investors to trawl through footnotes and appendixes peppered across press releases, investor presentations, websites, sustainability reports, CDP disclosures, and annual financial filings.
One key takeaway is that agreeing a simple standard protocol for publicly disclosing GHG reduction targets in particular could be a critical quick win, and should be central to the TCFD’s follow-up recommendations that are currently under development.
Takeaway
Still, having spent literally hundreds of hours trawling through thousands of pages of corporate climate disclosures to compile the benchmark, we do think that it is hard to argue that there isn’t something qualitatively different about the latest round of corporate climate disclosures.
For sure, greenwash, hyperbole, and ambiguity remain abundant. But it seems to be dawning on a growing number of carbon majors that denial, diversion, or delay are ceasing to be a viable option; and that beginning the long, daunting, and uncertain journey to actual decarbonization— however hesitantly—is now unavoidable.
This post first appeared on May 4 on the FTSE Russell blog.
Photo Credit: Chris Jones via Flickr Creative Commons
FOOTNOTES
[1] Net zero is a state where an entity is no longer adding any incremental greenhouse gas emissions to the atmosphere. This requires that any emissions that are produced are balanced by removals from the atmosphere, whether biological carbon sinks such as forests, or technological sinks such as direct air-capture systems.
[2] Eight other companies have been added to the CA 100+ focus list since the assessment exercise began.
[3] An indicator on Just Transition (9) is under development.
DISCLOSURE
© 2021 London Stock Exchange Group plc and its applicable group undertakings (the “LSE Group”). The LSE Group includes (1) FTSE International Limited (“FTSE”), (2) Frank Russell Company (“Russell”), (3) FTSE Global Debt Capital Markets Inc. and FTSE Global Debt Capital Markets Limited (together, “FTSE Canada”), (4) MTSNext Limited (“MTSNext”), (5) Mergent, Inc. (“Mergent”), (6) FTSE Fixed Income LLC (“FTSE FI”), (7) The Yield Book Inc (“YB”) and (8) Beyond Ratings S.A.S. (“BR”). All rights reserved.
FTSE Russell® is a trading name of FTSE, Russell, FTSE Canada, MTSNext, Mergent, FTSE FI, YB and BR. “FTSE®”, “Russell®”, “FTSE Russell®”, “MTS®”, “FTSE4Good®”, “ICB®”, “Mergent®”, “The Yield Book®”, “Beyond Ratings®” and all other trademarks and service marks used herein (whether registered or unregistered) are trademarks and/or service marks owned or licensed by the applicable member of the LSE Group or their respective licensors and are owned, or used under licence, by FTSE, Russell, MTSNext, FTSE Canada, Mergent, FTSE FI, YB or BR. FTSE International Limited is authorised and regulated by the Financial Conduct Authority as a benchmark administrator.
All information is provided for information purposes only. All information and data contained in this publication is obtained by the LSE Group, from sources believed by it to be accurate and reliable. Because of the possibility of human and mechanical error as well as other factors, however, such information and data is provided “as is” without warranty of any kind. No member of the LSE Group nor their respective directors, officers, employees, partners or licensors make any claim, prediction, warranty or representation whatsoever, expressly or impliedly, either as to the accuracy, timeliness, completeness, merchantability of any information or of results to be obtained from the use of FTSE Russell products, including but not limited to indexes, data and analytics, or the fitness or suitability of the FTSE Russell products for any particular purpose to which they might be put. Any representation of historical data accessible through FTSE Russell products is provided for information purposes only and is not a reliable indicator of future performance.
No responsibility or liability can be accepted by any member of the LSE Group nor their respective directors, officers, employees, partners or licensors for (a) any loss or damage in whole or in part caused by, resulting from, or relating to any error (negligent or otherwise) or other circumstance involved in procuring, collecting, compiling, interpreting, analysing, editing, transcribing, transmitting, communicating or delivering any such information or data or from use of this document or links to this document or (b) any direct, indirect, special, consequential or incidental damages whatsoever, even if any member of the LSE Group is advised in advance of the possibility of such damages, resulting from the use of, or inability to use, such information.
No member of the LSE Group nor their respective directors, officers, employees, partners or licensors provide investment advice and nothing contained in this document or accessible through FTSE Russell Indexes, including statistical data and industry reports, should be taken as constituting financial or investment advice or a financial promotion.
Past performance is no guarantee of future results. Charts and graphs are provided for illustrative purposes only. Index returns shown may not represent the results of the actual trading of investable assets. Certain returns shown may reflect back-tested performance. All performance presented prior to the index inception date is back-tested performance. Back-tested performance is not actual performance, but is hypothetical. The back-test calculations are based on the same methodology that was in effect when the index was officially launched. However, back- tested data may reflect the application of the index methodology with the benefit of hindsight, and the historic calculations of an index may change from month to month based on revisions to the underlying economic data used in the calculation of the index.