

By Guillaume Emin, senior manager, sustainable investment solutions
The pandemic is still damaging the health of the world’s population and economy despite the gathering pace of the vaccine rollout. But COVID-19’s macabre impact extends into the climate. It’s caused a massive decline in global CO2—the first of such magnitude for at least 70 years—and illustrates the challenge economies face reaching the Paris Agreement emissions targets.
We don’t have a precise answer for the exact size of the reduction, but informed estimates suggest a 6% fall of energy-related CO2 emissions in 2020. As the research journal Nature highlighted in May 2020:
“The estimated decrease in daily fossil CO2 emissions from the severe and forced confinement of world populations of -17% (-11 to -25%) at its peak are extreme and probably unseen before. Still, these only correspond to the level of emissions in 2006. The associated annual decrease will be much lower (-4.2 to -7.5% according to our sensitivity tests), which is comparable to the rates of decrease needed year-over-year for the next decade to limit climate change to a 1.5° C warming.” [my italics]
The only precedents for such a fall were in 1945, and in the aftermath of the 1929 Wall Street Crash and subsequent depression. The 2008-2009 Great Financial Crisis had a far lower impact on emissions.
Coincidentally, a 6% drop is consistent with what will be required every year in coming decades to achieve 1.5°C or 2°C alignment in line with the Paris Agreement. But it’s more complicated than that: solving the COVID-19 crisis would of course cancel most of the reduction achieved this year due to the shock. This suggests that the equivalent of a growing number of COVID-19 epidemics every year would be sufficient to achieve the needed climate alignment under such a scenario.
For example, without structural effects, the equivalent of about 11 COVID-epidemics would be needed in 2030. Effects of COVID-19 on energy use and GHG emissions are largely of a temporary nature. If COVID-19 disappeared and we were “back to normal” – as simplifying as it may sound –, GHG emissions would increase and be brought back to a similar level as before the shock, ceteris paribus. Reductions in CO2 emissions must be incremental, meaning that alignment with climate goals would require the same effects on greenhouse gas (GHG) emissions as those of an “additional” COVID-19 pandemic every year.
In other words, the equivalent of two COVID-19 like events would be needed in 2021, with a first one to keep the 6% reduction in CO2 emissions achieved in 2020 versus 2019, and an additional one to achieve an additional 6% reduction versus 2020. Similarly, three such events would then be needed in 2022, four in 2023, five in 2024… to reach 11 in 2030, 16 in 2035, and a number that would continue to grow until net global emissions are close to zero. Although the impact of a 6% annual reduction of CO2 emissions would be lower over time in absolute terms, this 6% additional relative decrease could become more and more challenging as low-hanging fruits are generally picked first.
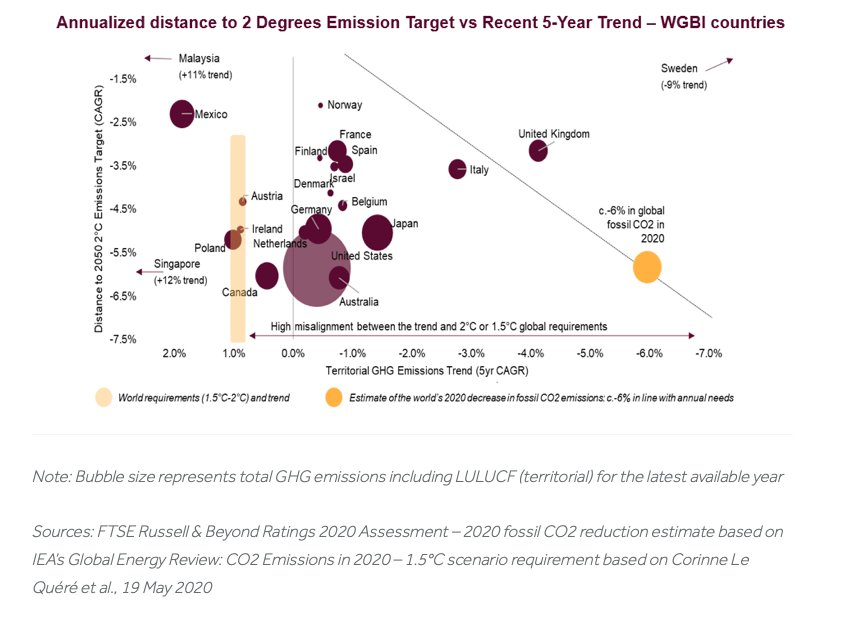
The climate risk adjustment of FTSE’s World Government Bond (WGBI) illustrates the gap between current trends and required reductions in global carbon emissions.
Note: Bubble size represents total GHG emissions including LULUCF (territorial) for the latest available year
Sources: FTSE Russell & Beyond Ratings 2020 Assessment – 2020 fossil CO2 reduction estimate based on IEA’s Global Energy Review: CO2 Emissions in 2020 – 1.5°C scenario requirement based on Corinne Le Quéré et al., 19 May 2020
The analysis of 22 WGBI countries shows that very few countries actually have a trend in line with what they should achieve based on a quantitative and statistical assessment. In fact, a good number of WGBI countries have increased their emissions, and this is also structurally the case of global emissions, with a +1%/year trend on a 5-year CAGR (based on latest data available). Over the last 30 years, global GHG emissions have actually decreased only in a very limited number of years, as during the 2009 shock.
In this context we remain far from target, and it is important to assess what countries will have to achieve the biggest shifts towards more ambitious transition efforts, and what countries are already on relatively aligned trajectories. Moreover, as suggested by the 2020 year of COVID, it remains extremely challenging to cut GHG emissions under business-as-usual economic scenarios. Historical GHG reductions have generally been associated with GDP losses and, beyond the numbers shown on our figure, this should give us a sense of the massive capital reallocation that is needed to cut our carbon emissions.
This article first appeared on March 26 on the FTSE Russell blog.
Photo Credit: Yuri Samoilov via Flickr Creative Commons
© 2021 London Stock Exchange Group plc and its applicable group undertakings (the “LSE Group”). The LSE Group includes (1) FTSE International Limited (“FTSE”), (2) Frank Russell Company (“Russell”), (3) FTSE Global Debt Capital Markets Inc. and FTSE Global Debt Capital Markets Limited (together, “FTSE Canada”), (4) MTSNext Limited (“MTSNext”), (5) Mergent, Inc. (“Mergent”), (6) FTSE Fixed Income LLC (“FTSE FI”), (7) The Yield Book Inc (“YB”) and (8) Beyond Ratings S.A.S. (“BR”). All rights reserved.
FTSE Russell® is a trading name of FTSE, Russell, FTSE Canada, MTSNext, Mergent, FTSE FI, YB and BR. “FTSE®”, “Russell®”, “FTSE Russell®”, “MTS®”, “FTSE4Good®”, “ICB®”, “Mergent®”, “The Yield Book®”, “Beyond Ratings®” and all other trademarks and service marks used herein (whether registered or unregistered) are trademarks and/or service marks owned or licensed by the applicable member of the LSE Group or their respective licensors and are owned, or used under licence, by FTSE, Russell, MTSNext, FTSE Canada, Mergent, FTSE FI, YB or BR. FTSE International Limited is authorised and regulated by the Financial Conduct Authority as a benchmark administrator.
All information is provided for information purposes only. All information and data contained in this publication is obtained by the LSE Group, from sources believed by it to be accurate and reliable. Because of the possibility of human and mechanical error as well as other factors, however, such information and data is provided “as is” without warranty of any kind. No member of the LSE Group nor their respective directors, officers, employees, partners or licensors make any claim, prediction, warranty or representation whatsoever, expressly or impliedly, either as to the accuracy, timeliness, completeness, merchantability of any information or of results to be obtained from the use of FTSE Russell products, including but not limited to indexes, data and analytics, or the fitness or suitability of the FTSE Russell products for any particular purpose to which they might be put. Any representation of historical data accessible through FTSE Russell products is provided for information purposes only and is not a reliable indicator of future performance.
No responsibility or liability can be accepted by any member of the LSE Group nor their respective directors, officers, employees, partners or licensors for (a) any loss or damage in whole or in part caused by, resulting from, or relating to any error (negligent or otherwise) or other circumstance involved in procuring, collecting, compiling, interpreting, analysing, editing, transcribing, transmitting, communicating or delivering any such information or data or from use of this document or links to this document or (b) any direct, indirect, special, consequential or incidental damages whatsoever, even if any member of the LSE Group is advised in advance of the possibility of such damages, resulting from the use of, or inability to use, such information.
No member of the LSE Group nor their respective directors, officers, employees, partners or licensors provide investment advice and nothing contained in this document or accessible through FTSE Russell Indexes, including statistical data and industry reports, should be taken as constituting financial or investment advice or a financial promotion.
Past performance is no guarantee of future results. Charts and graphs are provided for illustrative purposes only. Index returns shown may not represent the results of the actual trading of investable assets. Certain returns shown may reflect back-tested performance. All performance presented prior to the index inception date is back-tested performance. Back-tested performance is not actual performance, but is hypothetical. The back-test calculations are based on the same methodology that was in effect when the index was officially launched. However, back- tested data may reflect the application of the index methodology with the benefit of hindsight, and the historic calculations of an index may change from month to month based on revisions to the underlying economic data used in the calculation of the index.

