By Philip Lawlor, head of Global Investment Research
The jarring retreat in global bond markets this year has provoked comparisons to the mid-2013 Taper Tantrum, when the Fed hinted at the prospect of scaling back its QE program. While today’s upheaval shares many similarities with that earlier event, there are also some notable differences.
As during the 2013 Taper Tantrum, investors worry that a further disorderly back-up in long bond yields (or an earlier-than-expected Fed tightening move) could undermine a still-fragile economic recovery marked by falling but elevated joblessness and below-target inflation. The Fed’s relaxed response to the recent rise in both long-term inflation expectations and bond yields—despite a sharp upgrade in growth forecasts—has added to uncertainties.
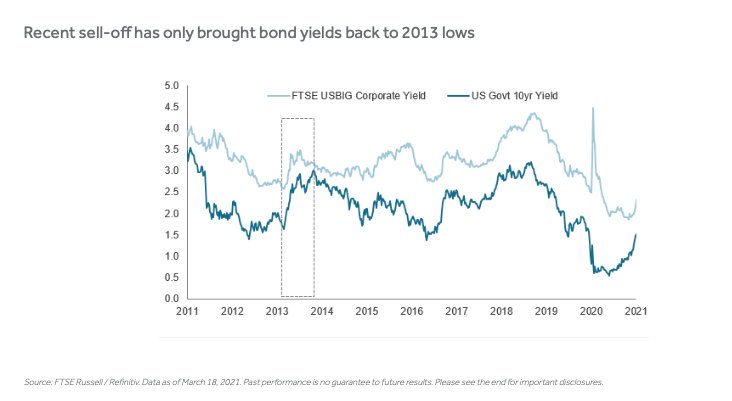
Recent sell-off has only brought bond yields back to 2013 lows
A very different macro and monetary policy backdrop
But economic conditions and the Fed policy framework are very different today than in 2013. While unnervingly swift, this recent repricing of inflation risk started off a significantly lower base, and after a far more devastating economic shock. US Treasury yields are only now approaching 2013 lows.
In the aftermath of the 2013 tantrum, government and corporate bond yields soon fell as the Bernanke Fed reaffirmed its commitment to maintaining QE for longer and did not start rising again until after the actual tapering began in late 2014. Today, in stark contrast, the Powell Fed has shown no intention of adjusting the $120 billion monthly bond-buying program or backing off from its new, more inflation-tolerant inflation policy regime.
Patient Fed vs hawkish bond-market expectations
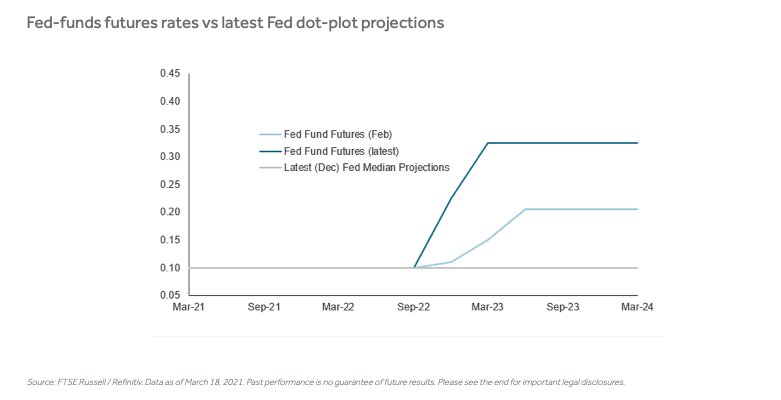
Yet, bond markets are clearly dubious about the Fed’s resolve. While market-implied rate expectations are closely aligned with the Fed’s median dot-plot projections for this year, they are now pricing in an earlier and bigger hike than even just a few weeks ago (see chart below). This contrasts with the FOMC timeline, which does not foresee raising rates until at least early 2024.
Fed-funds futures rates vs latest Fed dot-plot projections
Equities and bonds are diversifying again
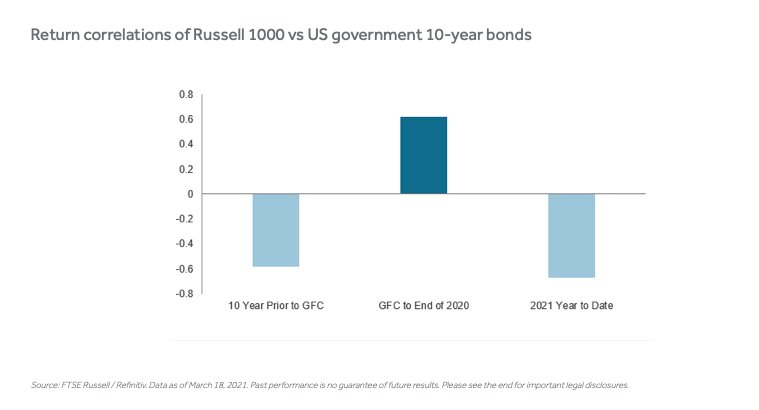
Equities have remained relatively buoyant despite recent bond-market ructions, leading return correlations between the two asset classes to turn negatively correlated again – after a decade of moving in unison with the onset of the Global Financial Crisis (GFC) and extraordinary central-bank policy interventions. The recent turnaround restores the inherent diversification benefits of a balanced asset allocation in place during the pre-GFC decade and historically.
Return correlations of Russell 1000 vs US government 10-year bonds
Global markets are likely to remain volatile as investors recalibrate positions to the very different macro environment and Fed policy regime unfolding in 2021 and beyond.
This article first appeared on March 24 on the FTSE-Russell blog.
Photo Credit: Pictures of Money via Flickr Creative Commons
© 2021 London Stock Exchange Group plc and its applicable group undertakings (the “LSE Group”). The LSE Group includes (1) FTSE International Limited (“FTSE”), (2) Frank Russell Company (“Russell”), (3) FTSE Global Debt Capital Markets Inc. and FTSE Global Debt Capital Markets Limited (together, “FTSE Canada”), (4) MTSNext Limited (“MTSNext”), (5) Mergent, Inc. (“Mergent”), (6) FTSE Fixed Income LLC (“FTSE FI”), (7) The Yield Book Inc (“YB”) and (8) Beyond Ratings S.A.S. (“BR”). All rights reserved.
FTSE Russell® is a trading name of FTSE, Russell, FTSE Canada, MTSNext, Mergent, FTSE FI, YB and BR. “FTSE®”, “Russell®”, “FTSE Russell®”, “MTS®”, “FTSE4Good®”, “ICB®”, “Mergent®”, “The Yield Book®”, “Beyond Ratings®” and all other trademarks and service marks used herein (whether registered or unregistered) are trademarks and/or service marks owned or licensed by the applicable member of the LSE Group or their respective licensors and are owned, or used under licence, by FTSE, Russell, MTSNext, FTSE Canada, Mergent, FTSE FI, YB or BR. FTSE International Limited is authorised and regulated by the Financial Conduct Authority as a benchmark administrator.
All information is provided for information purposes only. All information and data contained in this publication is obtained by the LSE Group, from sources believed by it to be accurate and reliable. Because of the possibility of human and mechanical error as well as other factors, however, such information and data is provided “as is” without warranty of any kind. No member of the LSE Group nor their respective directors, officers, employees, partners or licensors make any claim, prediction, warranty or representation whatsoever, expressly or impliedly, either as to the accuracy, timeliness, completeness, merchantability of any information or of results to be obtained from the use of FTSE Russell products, including but not limited to indexes, data and analytics, or the fitness or suitability of the FTSE Russell products for any particular purpose to which they might be put. Any representation of historical data accessible through FTSE Russell products is provided for information purposes only and is not a reliable indicator of future performance.
No responsibility or liability can be accepted by any member of the LSE Group nor their respective directors, officers, employees, partners or licensors for (a) any loss or damage in whole or in part caused by, resulting from, or relating to any error (negligent or otherwise) or other circumstance involved in procuring, collecting, compiling, interpreting, analysing, editing, transcribing, transmitting, communicating or delivering any such information or data or from use of this document or links to this document or (b) any direct, indirect, special, consequential or incidental damages whatsoever, even if any member of the LSE Group is advised in advance of the possibility of such damages, resulting from the use of, or inability to use, such information.
No member of the LSE Group nor their respective directors, officers, employees, partners or licensors provide investment advice and nothing contained in this document or accessible through FTSE Russell Indexes, including statistical data and industry reports, should be taken as constituting financial or investment advice or a financial promotion.
The Russell 1000 Index is a stock market index that tracks the highest-ranking 1,000 stocks in the Russell 3000 Index, which represent about 90% of the total market capitalization of that index. Investors can’t invest directly into indexes.
Past performance is no guarantee of future results. Charts and graphs are provided for illustrative purposes only. Index returns shown may not represent the results of the actual trading of investable assets. Certain returns shown may reflect back-tested performance. All performance presented prior to the index inception date is back-tested performance. Back-tested performance is not actual performance, but is hypothetical. The back-test calculations are based on the same methodology that was in effect when the index was officially launched. However, back- tested data may reflect the application of the index methodology with the benefit of hindsight, and the historic calculations of an index may change from month to month based on revisions to the underlying economic data used in the calculation of the index.