By Steve Sosnick, Chief Strategist at Interactive Brokers
Major news sources have begun reporting what many investors have already discovered – that volumes in “penny stocks” have exploded. While most of the media’s attention is focused upon highly capitalized household names, there is an entire investing ecosystem that is thriving with only a minimum of scrutiny. There are many worrisome signs surrounding OTC stocks, and it’s not just that the volume has exploded.
The SEC actually defines a penny stock primarily by what it is not (exact definition here), but its required disclosure broadly defines penny stocks as “low-priced shares of small companies” that “generally trade over-the-counter”. The over-the-counter market (OTC) is often called the “pink sheets”, because brokers would historically look for the dealers in these stocks in books printed on pink pages. The name persists even though the quotes have long since been distributed electronically.

The table below is the publicly available data on OTC stocks, distributed by FINRA. I encourage you to open the link in a separate tab for greater readability. Pay special attention to the columns entitled “Tot. Shares Vol.” and “Avg. Dollar Vol./Share ($)”:
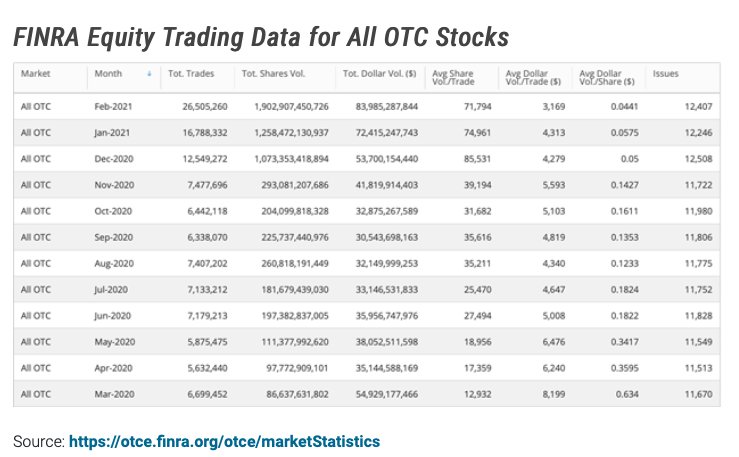
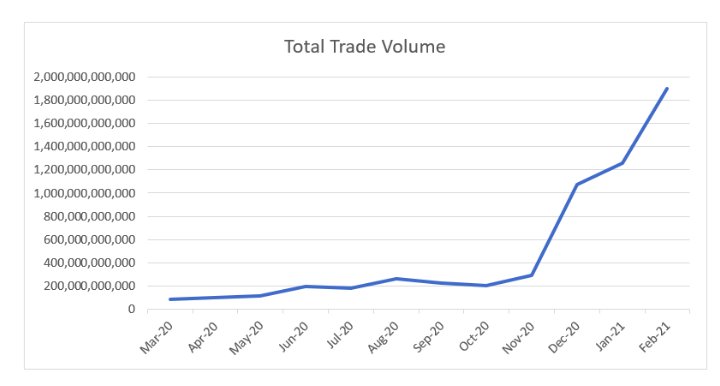
The statistics in those columns are quite revealing. The series that got the most attention is the Total Shares Volume. OTC share volumes are up about 22x – yes twenty-two times – over the past 12 months! Volumes went up over 3x in December and nearly doubled again by February. This staggering, exponential growth is what got the major media attention. I graphed the volumes in Excel to show how the solid pace of growth became truly extreme since November:
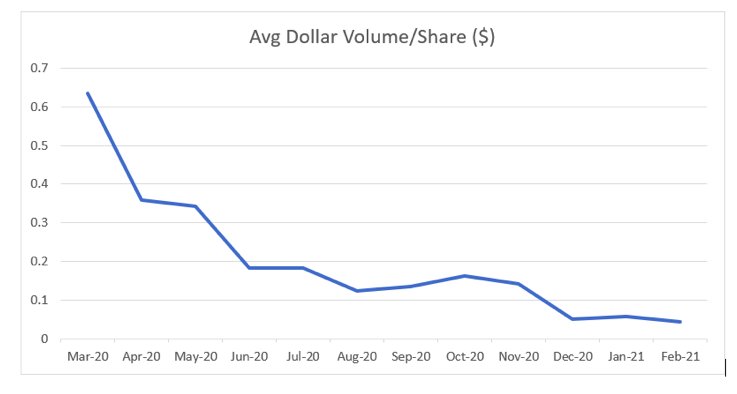
At the same time, the average price of a traded OTC share has plummeted steadily. The share price graph below is not nearly as dramatic as its counterpart above, but that is mainly because the price has become asymptotic to zero, as opposed to the parabolic rise in volume.
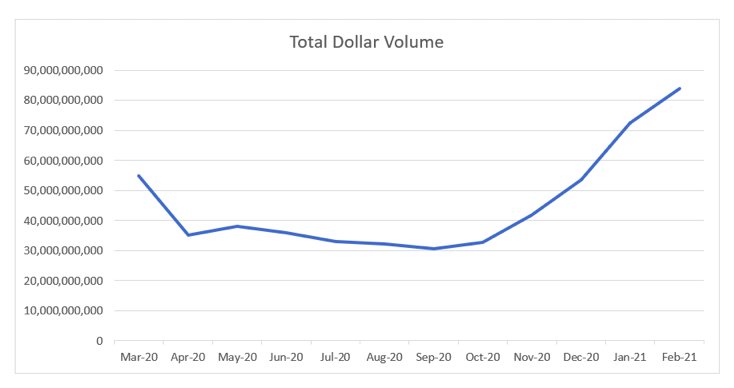
The dichotomy is largely resolved in a graph of the total dollar volume. That figure actually fell throughout much of the past year, only rebounding above year-ago levels in January:
The last graph tells an interesting story about how such huge share volumes can go largely unnoticed. I found the statistics for average daily trading in Tesla (TSLA) for the month of February. The average dollar volume traded on a given day in TSLA was about $22 billion. In other words, the total dollar volume for an entire record month on the OTC exchanges was equivalent to about 4 days’ worth of dollar volume in just one highly capitalized popular stock that is popular with individual and institutional traders.
Thus, at the same time that share volumes have been increasing exponentially, the average price of the shares has fallen steadily. That means that much of the volume explosion is in the lowest quality stocks. Also, after a brief bump, the average dollar volume of each trade has contracted to about $3,000. Again, this is a sign that more investors are taking small bets on the most beaten down names. Taken together, these are signs of true froth in the penny stock world. That is not unexpected, considering the number of new investors that have entered the market and their use of social media for information. Bull markets with high participation by retail investors have historically brought increases in penny stock volumes. It’s hard to resist what appears to be a lottery ticket. Unfortunately, scammers, promoters and pump-and-dump artists know this too – meaning it often ends badly for those who join the game at this point. Hopefully forewarned is forearmed.
This article first appeared on March 23 at Traders’ Insight
Photo Credit: slgckgc via Flickr Creative Commons
DISCLOSURE: INTERACTIVE BROKERS
The analysis in this material is provided for information only and is not and should not be construed as an offer to sell or the solicitation of an offer to buy any security. To the extent that this material discusses general market activity, industry or sector trends or other broad-based economic or political conditions, it should not be construed as research or investment advice. To the extent that it includes references to specific securities, commodities, currencies, or other instruments, those references do not constitute a recommendation by IBKR to buy, sell or hold such investments. This material does not and is not intended to take into account the particular financial conditions, investment objectives or requirements of individual customers. Before acting on this material, you should consider whether it is suitable for your particular circumstances and, as necessary, seek professional advice