Matthew J. Bartolini, CFA, Head of SPDR Americas Research, State Street Global Advisors
Like many of you, my daily routine has been upended. Rather than checking the box score from the prior night’s Boston Celtics game, I now search for the latest information on confirmed cases of COVID-19. Rather than commute into the city, I move from room to room while on phone calls trying not to disrupt the homeschooling going on. Nightly conversations about what happened at work have been replaced with what might happen next in the world and how we are going to keep the house “light.”
My typical commentary is filled with pop-culture references to make the financial markets a little more entertaining. Now, however, those references don’t feel appropriate considering the gravity of our situation. Two weeks ago, I made a reference in a blog to the movie “Heat.” That feels like years ago now, based on how quickly and dramatically our lives have changed.
Trying to Ease Nerves
This unprecedented time will no doubt spark furious academic debate, both from a humanitarian as well as a financial markets perspective – akin to the research that followed the great financial crisis and post-dot-com bear markets.
Currently, I find myself cultivating rich data sets to help put market movements in context and chart how ETFs are performing. Of course, showcasing how ETFs are being used in this market will do little to quell the stress in our lives stemming from having our daily routines upended. However, hopefully my observations might ease any anxiety investors may have related to ETFs.
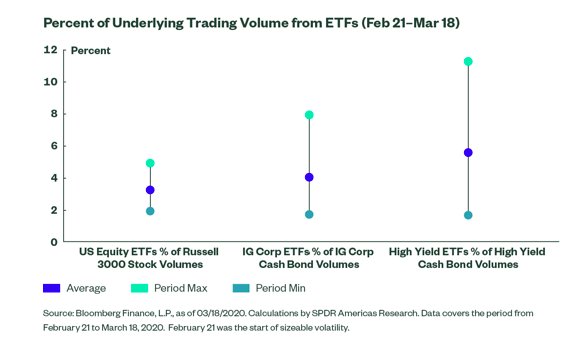
1. Low stock and bond volumes from the ETF primary market activity should not be seen as exacerbating market moves.
Coming out of the crash of 1987, ETFs were created to allow investors to participate in the market, while limiting the impact on the securities held by the funds. Based on these levels, the same market impact holds today.
As shown below, gross primary market activity of US equities, high yield bonds, and investment-grade bonds as a percentage of their underlying market’s trading activity has averaged less than 6% since February 21, 2020. For US equities, I took any ETF with a geographic focus and compared it with the total volume of all Russell 3000 stock volumes. For the fixed income analysis, the underlying market is represented by FINRA TRACE data.
In addition to the average figures, the daily max and min are also placed in the chart. Only for high yield did this metric surpass 10% on a single day.
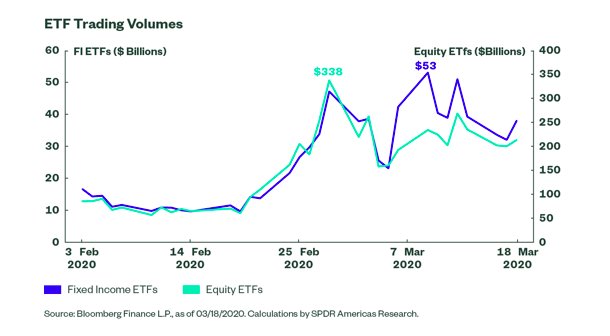
2. Trading volumes have increased across both equity and fixed income ETFs, hitting records.
ETFs are being used to make real-time asset allocation decisions and provide liquidity at a time when investors demand it most. With the uptick in volatility, investors have gravitated toward ETFs as a result of their onscreen liquidity, leading to a heavy increase in trading volumes across a multitude of market segments.
Both equity and fixed income ETF trading volumes have increased since February 21 and hit records, as illustrated in the chart below. Equity ETFs have traded, on average, $200 billion in the secondary market versus the normal average of $60 billion. Fixed income ETFs have traded an average of $37 billion – three times their normal average daily volume. Taken together, ETFs have represented 37% of all US exchange volume, versus the typical average of 26%.1
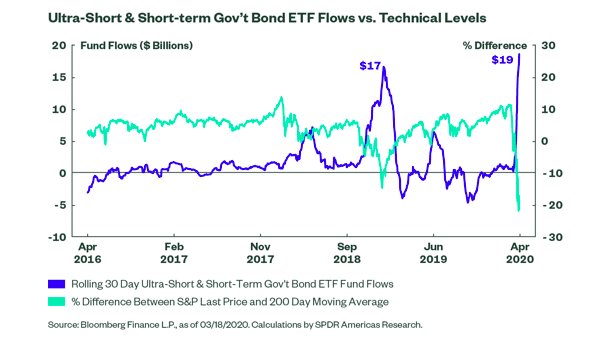
3. The rush to defensive ultra-short term government bond ETF exposures is outpacing 2018 levels.
In this market selloff, there has been a lack of information, and therefore, no information advantage. As a result, we have seen broad-based de-risking across many asset classes and a gravitation toward defensive areas. From a positioning perspective, we have seen investors uniquely favor ultra-short and short-term government debt.
To date in March, $17 billion has flowed into the ultra-short and short-term government debt ETF category, with inflows every day of the month. Inflows, in particular, picked up pace once key technical indicators (i.e., last price versus 200-day moving average) used by traditional trend-following equity strategies were breached, triggering a defensive shift.
The chart below depicts the rolling 30-day fund flows for this group of ETFs, and the most recent 30-day period, not surprisingly, outpaces the timeframe from 2018 when the S&P 500 fell close to 20%.
To read this article , which first appeared on the SPDR blog on March 20, please click here.
Photo Credit: Zooey via Flickr Creative Commons
This material is from State Street Global Advisors and is being posted with State Street Global Advisors’ permission. The views expressed in this material are solely those of the author and/or State Street Global Advisors and Interactive Advisors is not endorsing or recommending any investment or trading discussed in the material. The opinions expressed may differ from those with different investment philosophies. This material is not and should not be construed as an offer to sell or the solicitation of an offer to buy any security. To the extent that this material discusses general market activity, industry or sector trends or other broad-based economic or political conditions, it should not be construed or relied on as research or investment advice. To the extent that it includes references to specific securities, commodities, currencies, or other instruments, those references do not constitute a recommendation to buy, sell or hold such security. This material does not and is not intended to take into account the particular financial conditions, strategies, tax status, investment horizon, investment objectives or requirements of individual customers. Before acting on this material, you should consider whether it is suitable for your particular circumstances and, as necessary, seek professional advice.