

By Steve Sosnick, Chief Strategist at Interactive Brokers
Oh so many years ago, when I started in the business, Wall Street came to a halt on Thursday afternoons. Monetary aggregates were the economic indicators to watch and they were released by the Federal Reserve on Thursdays at 4:30 PM.
Markets lost their fascination with items like M2 and the Monetary Base several years ago, but I assert that the weekly Fed release contains the most important indicator for our current market environment – the Federal Reserve Balance Sheet.

One can attribute the equity market’s performance to myriad factors, but I believe that the supercharged rally of the past few months is a direct result of the Fed’s effort to stabilize the repo market. The shaky repo market required the Fed to purchase billions in short term US Treasury notes, and while the Fed denies that they have embarked upon another round of quantitative easing, the equity markets have reacted as though QE4 has begun.
Net Assets
The charts below show the relationship between the Fed balance sheet and the S&P 500 Index. Equity markets can and do rally while the Fed shrinks its net assets, though a rising balance sheet acts as a tail wind to equities, supercharging their rise.
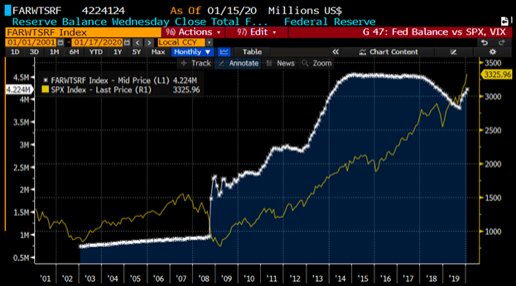
It is obvious that the Federal Reserve had a significant role in arresting the panic of 2008 and much of the ensuing rally was accompanied by an expanding Fed balance sheet.
Equity markets were able to continue advancing despite a plateau in the balance sheet thanks to an earnings recovery and later the promise of fiscal stimulus from tax cuts. Interestingly, the balance sheet continued to contract even after the Fed appeared to pivot its monetary stance in late 2018.
Balance Sheet
The effects of that balance sheet contraction were largely ignored by stock markets in favor of the Fed Funds target rate cuts throughout last year, but those effects must have been felt in the repo markets. It remains unclear why the Fed felt compelled to step in to stabilize that crucial funding market.
Theories range from the technical, like a shortage of high-quality collateral, to the dire, like a large bank in crisis. Regardless, stock markets focused on the flow of money rather than obsessing over the reason for the Fed’s largesse. This is obvious in the 6-month chart below:
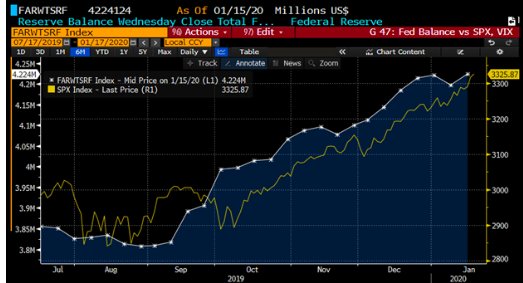
Financial Flows
It took a few weeks for the stock markets to catch on to the new financial flows – monetary policy always acts with a lag – but the powerful rally to new index highs has been in lockstep with the Fed balance sheet since early October.
That is why I have become laser focused on the Federal Reserve’s monetary releases at 4:30 every Thursday, as I was at the beginning of my career. For now, those releases are not signaling an end to the liquidity fueled rally.
But if we see a meaningful plateau or even a decline in the balance sheet, that could presage a turn. Thanks to the lag in monetary policy’s effect, that signal could give those who are alert to the Fed’s movements advance warning to a potential change in the broad market’s footing. Doesn’t every investor want an early warning?
That’s why I’ll expect to find you looking at the Federal Reserve’s monetary release next Thursday at 4:30.
This article was first published on Traders’ Insight blog on January 17.
Photo Credit: 401(k) 2012 via Flickr Creative Commons

