With 2017 winding down, it’s pretty clear this has been an awesome year for stock investors.
The Dow Jones Industrial Average and S&P 500 Index are up 18% and 23%, respectively, as of Dec. 11.
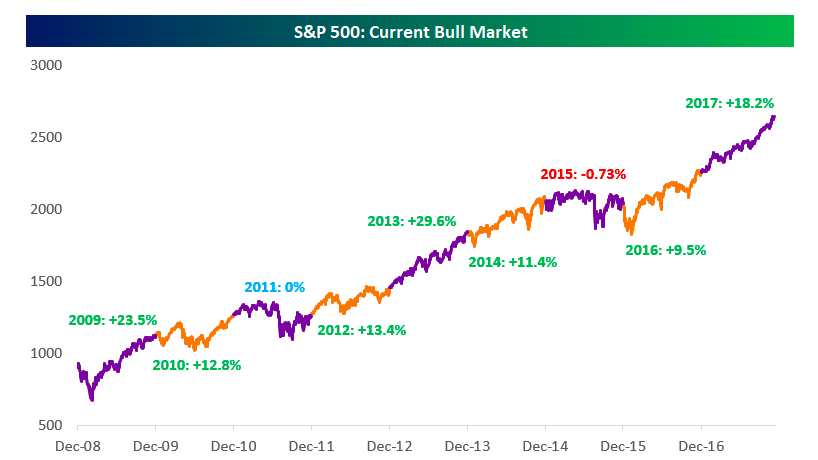
Yet if you pull out the wide-angle lens for a moment, the bull market that started in March of 2009 has delivered far bigger calendar year gains, according to an analysis by Bespoke Investing Group .
Sweet 2013
Back in 2013, the S&P 500 rocketed up nearly 30%.
And after touching its bear-market low in March of 2009 in the wake of the global financial crisis, the index advanced 23.5% at the end of that year.
Even the down years have been gentle.
The current bull market has only paused twice. It was flat in 2011 and down nearly 1% in 2015.

Whither 2018?
Now, the focus shifts to 2018.
Will the market tumble after a big year as investors take profits amid elevated valuations?
Or will the double-digit momentum amid strong corporate earnings and an economy growing more than 3% add up to another strong year of stock market gains?
Bullish Analysts
Bloomberg recently surveyed Wall Street analysts that have published their 2018 stock market forecasts and the market oracles are upbeat.
BMO Chief Investment Strategist Brian Belski predicts the S&P 500 will end next at 2,950, or up about 10% from the 2,659 current level.
Deutsche Bank AG’s Binky Chadha is forecasting 2,850 for the S&P 500. Chris Harvey at Wells Fargo, meanwhile, sees returns in the 6% to 7% range.
Corporate Earnings
Wall Street analysts tend to be a very bullish lot.
In my opinion, it’s best to keep an eye on earnings.
The data show a pretty strong relationship between earnings and stock performance.
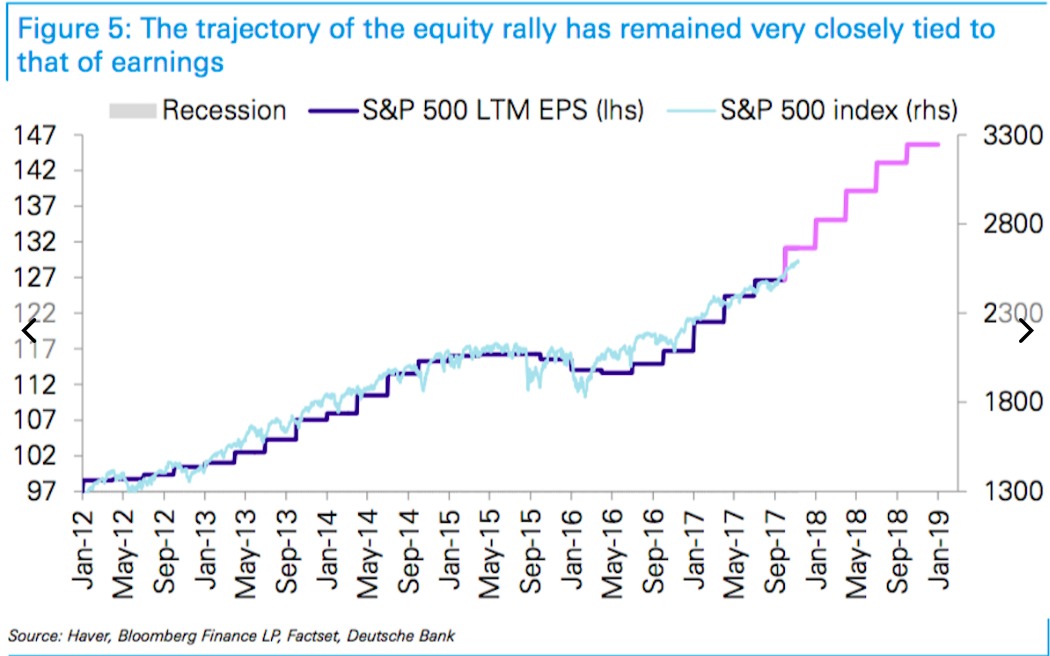
Take a look at this chart that tracks the last twelve month (LTM) earnings per share of the S&P 500 and the S&P 500 Index.
Stock Illusions
At the same time, don’t fall into the trap of thinking that one calendar-year of market performance will necessarily have any impact on 2018.
Bespoke Investment did a statistical analysis of the current bull market, looking for year-to-year correlations that might be useful to investors looking ahead.
Take a look at this scatter chart.
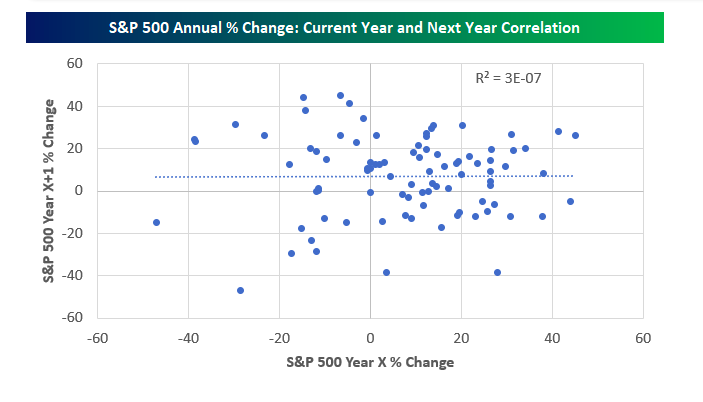
As Bespoke Investment analysts point out:
If the contrarian bet were true, you’d see a trend-line in the scatter chart that goes from the upper left to the lower right. If the momentum bet were true, you’d see a trend-line that goes from the lower left to the upper right.
Instead, what Bespoke found was no discernible pattern either way.
Takeaway
Investors have a lot to be grateful for as 2017 draws to a close.
The current bull market may have more oomph heading into 2018 as long as corporate earnings remain robust and the economy continues to expand.
Happy investing.
Photo Credit: toenails via Flickr Creative Commons