

by Michael Tarsala, CMT
There are the two things that will tell me when the stock market is entering a rally mode again.
One is simply the green light from Mike Arold, manager of the Technical Swing model at Covestor.
I think Mike has an excellent sense of market timing, and has one of the best eyes for trading out of the more than 115 investment model managers on the Covestor platform. Mike was very cautious with his positions in April and May, at one point moving more than 80% of his portfolio to cash. Last week, he started playing potential bounces and stocks with improving relative strength.
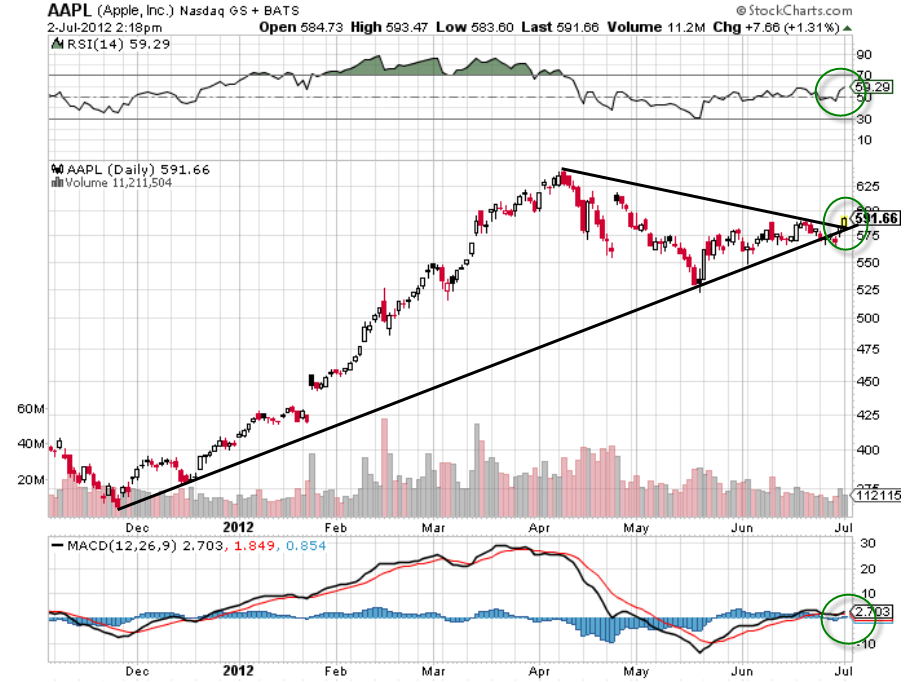
Part of his rationale was the very low readings in the McClellan Oscillator. Arold notes that bounces in the past three years from extremely low McClellan readings resulted in market moves of greater than 5%… so he made a number of opportunistic trades in stocks including Apple (AAPL), Chipotle (CMG) and Toll Brothers (TOL).
He’s not all in, though. Arold is keeping about a 25% short position, a 20% cash position, and about 55% long, right now, he says. He thinks that there could be opportunities to re-short and become more conservative again after the bounce.
Once Arold starts feeling more confident that the downside has passed, I will think about buying broadly, as well.
There is something else: I want to see the conservative asset classes begin to falter — mainly the utilities, and to a lesser degree the consumer staples and health care stocks.
Utilities tend to perform when the markets are down. Sure enough, they led the way and had the best sector performance last month.

Source: StockCharts.com
You can learn a thing or two from looking at the chart above closely.
The candles in red and black chart the utilities ETF (the XLU) relative to the SPY. And the black line on the chart is the S&P 500 by itself.
What you’ll notice is a turnaround in extreme performance by the XLU versus the SPY helped to mark major stock market turning points in each of the past two years.
Right now, the performance of that relationship is near an extreme, but not quite there. The RSI at the top of the chart is at a reading of 60.
In each of the past two years, a drop in that RSI line once it reached 70 or above gave an early hint of a coming stock market rally.
I, for one, am looking for history to possibly repeat itself, and for this signal to provide a heads up yet again.

