

By: Michael Kramer
Markets sold off on Friday following headlines about increased tensions between Israel and Iran. Obviously, I was unaware of these events when writing on Thursday. This underscores why understanding factors like volatility and correlations is crucial—it makes the market more vulnerable to headline risk.
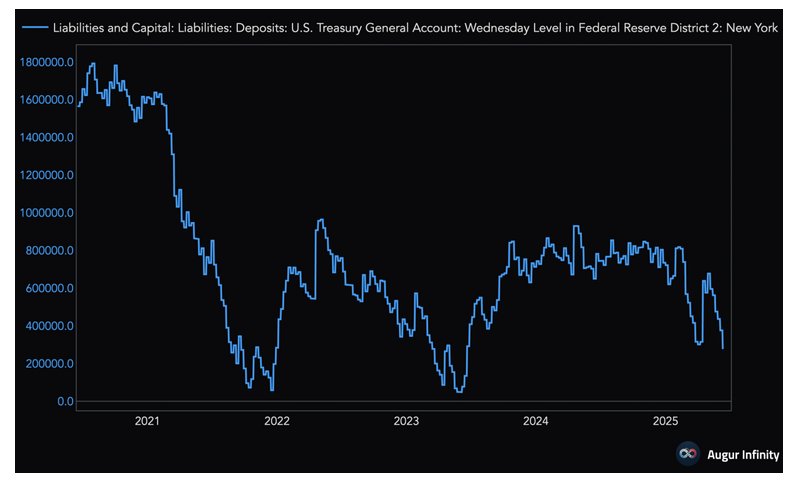
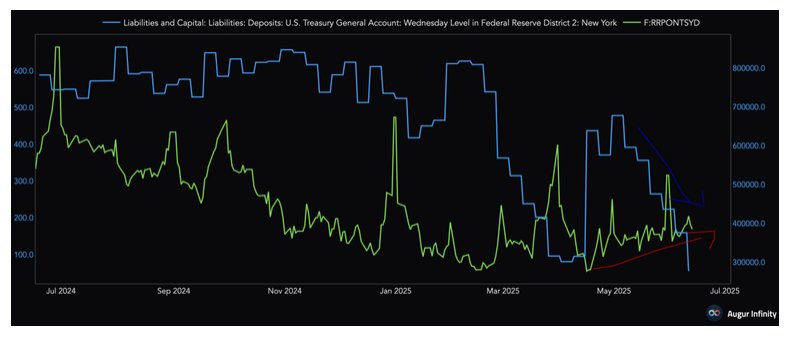
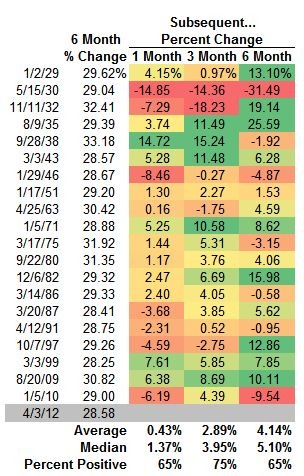
This week is also significant due to tax payments. The Treasury General Account (TGA) has fallen sharply because of the debt ceiling. When the TGA declines, it increases reserve balances held at the Fed, injecting liquidity into the system. Conversely, when the TGA rises, it reduces reserve balances at the Fed, draining liquidity from the market.
Some of that liquidity has flowed right back to the Fed through the reverse repo facility, which has been steadily trending higher since May—but not nearly enough to offset the drop in the TGA.
This excess liquidity is visible in the decline in overnight funding rates, with the Secured Overnight Financing Rate (SOFR) now trading 5 basis points below the Fed’s effective funds rate. This matters because it indicates ample liquidity in the overnight market. However, the situation is likely to change this week due to the tax date on June 15, which will push the TGA higher, reserves lower, and prompt government-sponsored entities to move funds into the repo market.
The increased liquidity in the overnight funding market will likely keep SOFR suppressed and may even push it lower. If SOFR declines further, it will make the Fed’s overnight repo facility more attractive, leading to increased reverse repo usage. As reverse repo values rise alongside a climbing TGA, reserve balances at the Fed will decline, further tightening liquidity. Additionally, reverse repo facility usage typically continues to rise as we approach quarter-end due to balance-sheet adjustments, further reducing market liquidity.
Therefore, over the next two weeks, overnight funding rates should initially decline but then start to rise as quarter-end approaches, causing liquidity to tighten. This pattern generally occurs at the end of each month but tends to be more pronounced at quarter-end.
The effects of a rising TGA due to tax payments this week, increased repo usage heading into quarter-end, and higher overnight funding costs are likely to reduce overall market liquidity. This combination could make trading conditions challenging over the final two weeks of June, potentially placing significant downward pressure on stock prices.
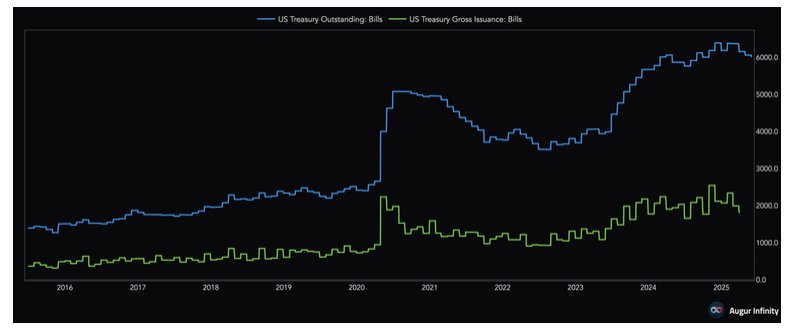
The situation becomes more complicated after quarter-end. If the triple “B” bill is signed into law by July 4 as planned, the TGA will need to be rebuilt, and market conditions will depend heavily on how Treasury chooses to issue debt. Recently, however, Treasury bill issuance has slowed, and the total amount of T-bills outstanding has declined.
Even with Friday’s 1% sell-off, realized volatility remains subdued, with the 10-day volatility at just 9.4. Additionally, implied correlation began rising on Friday. This suggests there’s still considerable room for these metrics to move higher.
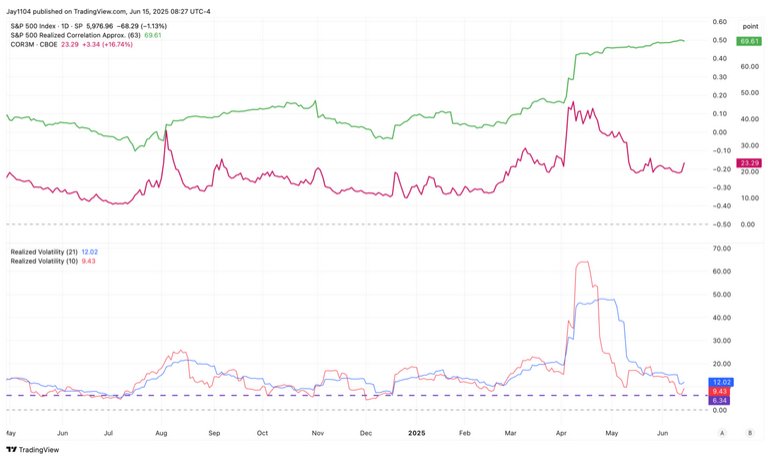
The S&P 500 finally broke the wedge pattern it had formed, and now we need to see follow-through to the downside. That doesn’t mean it must happen immediately in one day, but the downward trend should become clear. It’s also worth noting that the index closed below its 10-day exponential moving average on Friday.
The decline in the NASDAQ 100 (NDX) provided additional confirmation of the weakness observed in the S&P 500.
Arguably, Nvidia also had a significant breakdown on Friday, falling out of its rising wedge pattern and breaking its long-term uptrend from the April lows. The only notable exception was that it didn’t close below its 10-day EMA.
Originally posted on June 15, 2025. For more charts, see Mott Capital blog
PHOTO CREDIT: https://www.shutterstock.com/g/welcomia
VIS SHUTTERSTOCK
FOOTNOTES AND SOURCES
Terms By CHATGPT
- Treasury General Account (TGA): The U.S. government’s checking account at the Federal Reserve used for daily expenditures and revenue collections.
- Reverse Repo Facility: A Federal Reserve tool that absorbs liquidity from the banking system by accepting cash from financial institutions in exchange for securities, effectively draining excess reserves.
- Secured Overnight Financing Rate (SOFR): An overnight interest rate that banks pay when borrowing cash secured by U.S. Treasury securities, often used as a benchmark for lending rates.
- Fed’s Effective Funds Rate: The weighted average interest rate at which banks lend reserve balances to each other overnight.
- Implied Correlation: A market-derived measure reflecting investor expectations of how individual stocks within an index will move together.
- Exponential Moving Average (EMA): A technical indicator that places greater weight on recent prices to identify trends and potential reversals.
- Triple “B” Bill: Likely refers to specific pending U.S. legislation—clarification would be useful if this is specialized or lesser-known legislation.
- Government-Sponsored Entities (GSEs): Financial institutions created by Congress, such as Fannie Mae and Freddie Mac, designed to enhance the flow of credit to specific sectors.
- Quarter-End Liquidity: Financial market dynamics often characterized by increased activity or balance-sheet adjustments by financial institutions at the end of each quarter
DISCLOSURES
This report contains independent commentary to be used for informational and educational purposes only. Michael Kramer is a member and investment adviser representative with Mott Capital Management. Mr. Kramer is not affiliated with this company and does not serve on the board of any related company that issued this stock. All opinions and analyses presented by Michael Kramer in this analysis or market report are solely Michael Kramer’s views. Readers should not treat any opinion, viewpoint, or prediction expressed by Michael Kramer as a specific solicitation or recommendation to buy or sell a particular security or follow a particular strategy. Michael Kramer’s analyses are based upon information and independent research that he considers reliable, but neither Michael Kramer nor Mott Capital Management guarantees its completeness or accuracy, and it should not be relied upon as such. Michael Kramer is not under any obligation to update or correct any information presented in his analyses. Mr. Kramer’s statements, guidance, and opinions are subject to change without notice. Past performance is not indicative of future results. Neither Michael Kramer nor Mott Capital Management guarantees any specific outcome or profit. You should be aware of the real risk of loss in following any strategy or investment commentary presented in this analysis. Strategies or investments discussed may fluctuate in price or value. Investments or strategies mentioned in this analysis may not be suitable for you. This material does not consider your particular investment objectives, financial situation, or needs and is not intended as a recommendation appropriate for you. You must make an independent decision regarding investments or strategies in this analysis. Upon request, the advisor will provide a list of all recommendations made during the past twelve months. Before acting on information in this analysis, you should consider whether it is suitable for your circumstances and strongly consider seeking advice from your own financial or investment adviser to determine the suitability of any investment.


