

By Matthew J. Bartolini, CFA, Head of SPDR Americas Research, State Street Global Advisors
Over $7 trillion of US Treasury debt has a yield below 1%, adding to the $43 trillion of global total debt that trades below a 1% yield.1 Low policy rates, low growth, low relative inflation, and investors playing defense amid heightened macro risk from the Global COVID-19 Crisis (“the GCC”) have all played a part in this new low/no-rate era in the US and across the world.
With a looming US presidential election, ongoing Fed purchases of Treasuries amid heightened Treasury supply to fund the fiscal stimulus plans – not to mention a potential second Congressional stimulus plan – along with the hopes of an economic recovery as communities continue to reopen, the outlook for interest rates is quite uncertain. This is even though implied interest rate volatility has been in the bottom 1 percentile over the past three years, as we show in our cross-asset volatility monitor in this month’s Chart Pack.
In this charting the market, we will take a look at a few charts to help frame a view on the path of rates as we get deeper into a wild and weird 2020.
Two trends differ
In this month’s Chart Pack, we depict current and historical trends of the US 10-year yield’s relationship to two macroeconomic activity barometers: the ISM US Manufacturing PMI and the copper-to-gold ratio. The two metrics are different, as one could think of PMI as a lagging indicator, given that the activity was already registered, while copper-to-gold is a leading metric, given that it’s derived from investor pricing expectations. It may also include some aspects of global trends, given the usage of the metals on a global scale.
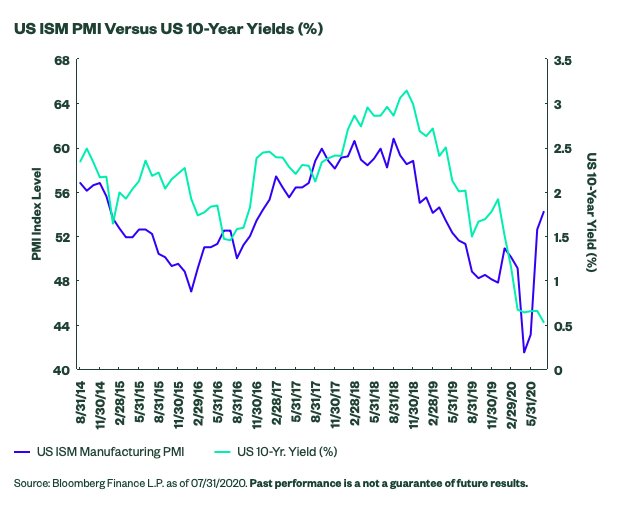
Historically, the US 10-year yield has trended in the same direction as the ISM US Manufacturing PMI, considering that the latter illustrates economic activity and the US 10 year ultimately reflects future growth and inflation expectations. As a result of the impacts from the GCC, the initial reactions of both of these variables were similar. However, with some communities and companies reopening, the ISM has bounced back. Yet, the US 10-year yield has remained constrained, as shown below.
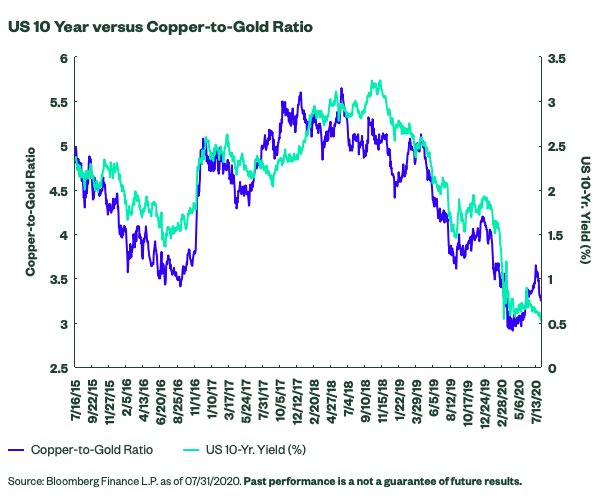
Contrary to the above trend, after a brief decoupling, the copper-to-gold ratio has started to revert to be back in line with the US 10-year yield. Similar to the insights gleaned from PMI, the copper-to-gold ratio can provide information about the outlook for the economy, as copper is more of an industrial metal that should reflect an uptick in economic activity, while the yellow metal is more of a safe-haven/preservation of wealth/defensive commodity. As a result, the ratio should follow a directional trend similar to that of the US 10-year yield. As shown below, since the deviation in early July, the copper-to-gold ratio has fallen.
Breaking down the ratio, copper initially rallied based on reopening hopes, but lately, gold prices have surged in large part due to a weakening dollar and the fact that low real rates are likely increasing the relative attractiveness of gold – a trend we also show in the Chart Pack.
Also, over the past few weeks, the stronger gold prices have coincided with increased concerns surrounding the potential impairment of US economic growth momentum from uneven community reopenings as a result of COVID-19 hot spots emerging. The ratio and 10-year rates are now moving in the same direction as a result, and since the rate of change is higher for the ratio than the US 10-year yield, the gap between the two is narrowing.
The GCC has upended behaviors and changed trends’ lines across a multitude of markets, and perhaps, old indicators are no longer useful. However, PMI levels do indicate that yields should be higher. Yet, the copper-to-gold ratio offers support for these low levels. This disagreement is reflective of the uncertain converging forces at play.
Converging forces at play
The Federal Reserve has extended their balance sheet significantly to increase liquidity and offer support to the capital markets, creating an embedded constant buyer of Treasuries (roughly $80 billion a month) – as well as other debt instruments .
Conversely, at the same time, the sizable fiscal stimulus has and will continue to increase supply – nominal coupon issuance will climb $132 billion over the next quarter. 2 There is also a looming election that could have an impact on the rates market.
However, it is unlikely to roil it like it did back in the 2016 election – when interest volatility increased by 55% and the US 10-year rose almost 100 basis points – as GCC-related uncertainties plus an extremely dovish Fed are likely to temper any wild swings upwards.
But that’s not to say that the election won’t have an impact, as three-month implied interest rate swaption volatility is above that of one- and six-month implied swaption volatility, as the three-month expiry covers the time period of the election.3 And there is a scenario in which the election could be contested or results delayed due to the increased usage of mail-in voting, where the victor is not known until well after November 3.
If that scenario does come to fruition, safe havens are likely to be sought, and that could pressure yields lower around that event. In November of 2000, when the Florida recount occurred for the Bush-Gore election, US 10-year yields fell 60 basis points through December 13, 2000 4 while all the hanging chads were being sifted through.
Regardless of the outcome, both administrations are likely to increase spending to combat the pandemic, and this will most certainly increase Treasury supply, impacting the yield curve by pushing longer-term rates higher, as stimulus should be inflationary. The supply, the stimulus, and the potential for political schadenfreude are all likely to impact the path and pace of the rates market ahead. But the risks are likely asymmetrical, leaving few reasons to buy.
Reasons to buy?
From a pure portfolio construction perspective, there are three fundamental reasons to buy Treasuries.
- Income
- Defense
- Total Return from falling rates and the duration-induced price appreciation
For reason number one, Treasuries provide little income now, considering that the entire yield curve is under 1.3% and 30-year yields are 58 basis points lower than those of large-cap stocks.5 This is one of the reasons why we have seen ETF investors shed government bonds ($4 billion of outflows in July) in favor of IG and high yield corporates ($12 billion of inflows in July) as of late.
For number two, of course, the defense still exists, as Treasuries have the backing of the full faith and credit of the US – even if Fitch portends the outlook to be negative.6 However, the price of the defense is not what it used to be, as Treasuries’ yield per unit of duration is at its lowest point ever, at 0.05 7 – meaning that the risk-return profile is asymmetrical and there is more downside risk than upside, as the income produced may not be sufficient to cover any duration-induced price declines.
Given this structural deficiency from a risk-return perspective, this has led investors to seek out other potential portfolio risk mitigation solutions, such as gold – as evidenced by seven consecutive months of over $1 billion of inflows into gold-related ETFs, which have raised the 2020 total flow figure to north of $30 billion.
For number three, traditional paradigms have been upended, so historical comparisons to forecast mean reversion are not as reliable as they usually are. However, our preferred historical measure is the current yield difference to an exponential 36-month moving average, which reveals that current yield levels are 67% below that metric – the largest discount ever. This indicates that mean reversion is more likely than a continued move lower, and Fed Chair Powell has been dismissive of the idea of negative rates as well.8
To read this entire article, originally published on Aug. 10 on the SPDR Blog, please go here.
Photo Credit: 401(K) 2012 via Flickr Creative Commons
Footnotes
1 Based on the holdings of the Bloomberg Barclays Global Aggregate Bond Index as of 08/05/2020 per Bloomberg Finance L.P.
2 “U.S. Borrowing Breaks Fresh Records, Shifting Focus to the Fed”, Bloomberg 8/5/2020
3 “U.S. Presidential Election Bulldozes Its Way Into Rates Market”, Bloomberg 08/05/2020
4 This was the day Al Gore conceded the election
5 Based on the S&P 500 Index dividend yield as of 08/05/2020.
6 “United State Outlook to Negative by Fitch” Bloomberg, 08/01/2020
7 Bloomberg Barclays US Treasury Index yield to worst is 0.40 and the duration is 7.39, leading to yield per unit of duration of 0.05 per Bloomberg Finance L.P. as of 08/05/2020
8 “Fed chair Powell: The US won’t have negative interest rates”, CBSNews 5/18/2020
Disclosure
The views expressed in this material are the views of SPDR Americas Research Team and are subject to change based on market and other conditions. This document contains certain statements that may be deemed forward-looking statements. Please note that any such statements are not guarantees of any future performance and actual results or developments may differ materially from those projected.
The information provided does not constitute investment advice and it should not be relied on as such. It should not be considered a solicitation to buy or an offer to sell a security. It does not take into account any investor’s particular investment objectives, strategies, tax status or investment horizon. You should consult your tax and financial advisor.
All material has been obtained from sources believed to be reliable. There is no representation or warranty as to the accuracy of the information and State Street shall have no liability for decisions based on such information.
All the index performance results referred to are provided exclusively for comparison purposes only. It should not be assumed that they represent the performance of any particular investment.
Passively managed funds hold a range of securities that, in the aggregate, approximates the full Index in terms of key risk factors and other characteristics. Passively managed funds invest by sampling the index, holding a range of securities that, in the aggregate, approximates the full Index in terms of key risk factors and other characteristics. This may cause the fund to experience tracking errors relative to performance of the index.
Actively managed funds do not seek to replicate the performance of a specified index. The strategy is actively managed and may underperform its benchmarks. An investment in the strategy is not appropriate for all investors and is not intended to be a complete investment program. Investing in the strategy involves risks, including the risk that investors may receive little or no return on the investment or that investors may lose part or even all of the investment.
Equity securities may fluctuate in value in response to the activities of individual companies and general market and economic conditions.
Volatility management techniques may result in periods of loss and underperformance may limit the Fund’s ability to participate in rising markets and may increase transaction costs.
A momentum style of investing emphasizes securities that have had higher recent price performance compared to other securities, which is subject to the risk that these securities may be more volatile and can turn quickly and cause significant variation from other types of investments.
Investments in small-sized companies may involve greater risks than in those of larger, better known companies.
Companies with large market capitalizations go in and out of favor based on market and economic conditions. Larger companies tend to be less volatile than companies with smaller market capitalizations. In exchange for this potentially lower risk, the value of the security may not rise as much as companies with smaller market capitalizations.
Value stocks can perform differently from the market as a whole. They can remain undervalued by the market for long periods of time.
Because of their narrow focus, sector funds tend to be more volatile.
Investing involves risk including the risk of loss of principal.
The whole or any part of this work may not be reproduced, copied or transmitted or any of its contents disclosed to third parties without SSGA’s express written consent.


