

By: Michael Kramer
Stocks have consolidated over the past week and are currently positioned at a critical technical crossroads. The S&P 500 is wedged between the 61.8% Fibonacci retracement level and its 200-day moving average. This intersection around the July 2024 high near 5,710 previously served as substantial resistance in mid-March, emphasizing the significance of this technical juncture. Additionally, a rising wedge formation on the S&P chart suggests a potential short-term upside move to approximately 5,750—just enough to touch the 200-day moving average—before the pattern resolves lower.

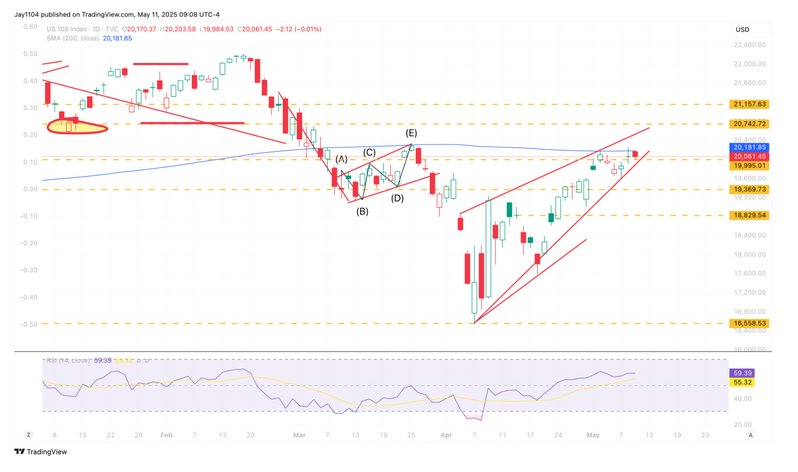
The NASDAQ exhibits a parallel scenario, featuring a clear rising wedge pattern centered around the pivotal 20,000 level, also intersecting with the 61.8% retracement and its 200-day moving average. Technical analysis indicates that a reversal lower is increasingly probable, initially targeting a retracement down toward the 17,900 area. Historically, such rising wedge patterns often result in moves that undercut previous lows, suggesting the potential for a deeper corrective scenario.
Notably, the BTIC S&P 500 Total Return futures contracts remain unconfirmed. Despite minor gains at the end of last week, these futures remain at historically low levels, signaling skepticism about the durability of the current market advance and raising concerns regarding the potential divergence between futures positioning and underlying stock prices.
From a macroeconomic perspective, attention will be heavily focused on inflation indicators this week, including CPI, PPI, and import/export prices. Elevated prices-paid indexes, consistently highlighted in recent regional Fed and ISM PMI reports, have historically served as leading indicators of rising import prices. The current trajectory of these indicators strongly implies a significant uptick in import prices, potentially signaling accelerating inflationary pressures in the coming months and the latter half of the year.
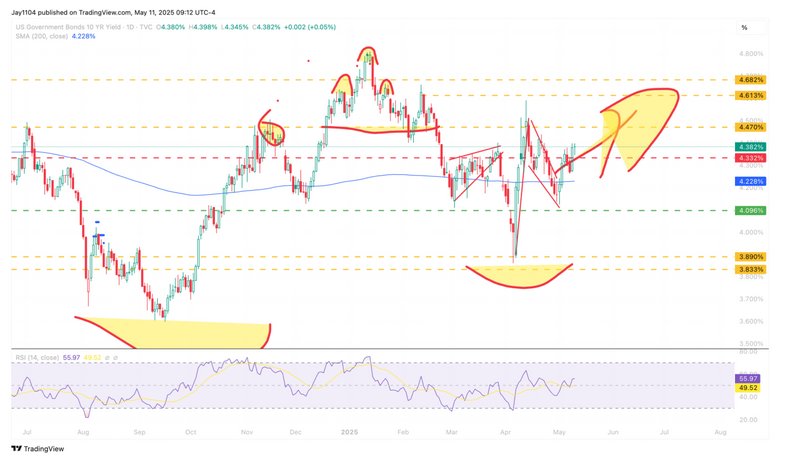
This anticipated inflation backdrop reinforces expectations for rising Treasury yields. The 10-year yield is technically positioned near 4.60% and appears poised to advance towards the 4.70% range, supported by the development of a bullish flag pattern.
Similarly, the 30-year yield continues to test critical resistance around 4.80%, with technical structures pointing to a potential breakout above 5.00%, possibly reaching as high as 5.16%.
Such movements would substantially steepen yield curves, notably impacting the 10-year minus 2-year and the 30-year minus 3-month spreads, both poised to widen materially.
Turning to currencies, the dollar shows a bearish flag formation, suggesting further weakness. Meanwhile, the euro is holding critical support around 1.12; a breach here could see a swift move toward the 1.09 area. Conversely, sustained support could trigger a strengthening move higher.
The Japanese yen is encountering resistance at its 50-day moving average near the 146 level, marking a pivotal area for currency markets.
Finally, volatility in Asian currencies, particularly the Taiwan dollar amid ongoing U.S.-China trade talks, warrants close monitoring. After substantial strengthening last week, recent volatility signals uncertainty and potential further shifts in market sentiment.
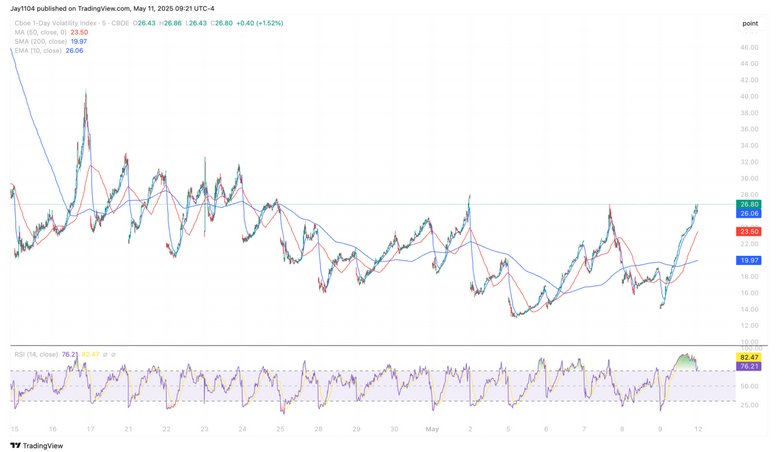
The spike in one-day VIX implied volatility on Friday suggests an early-week bounce may be likely, driven by volatility reset dynamics. However, given the technical and fundamental backdrop, any initial gains could quickly fade, underscoring the importance of caution as markets navigate this significant technical and macroeconomic inflection point.
Originally posted on May 11, 2025. See Mott Capital blog for more data charts.
PHOTO CREDIT: https://www.shutterstock.com/g/bmccarroll
VIA SHUTTERSTOCK
DISCLOSURES:
This report contains independent commentary to be used for informational and educational purposes only. Michael Kramer is a member and investment adviser representative with Mott Capital Management. Mr. Kramer is not affiliated with this company and does not serve on the board of any related company that issued this stock. All opinions and analyses presented by Michael Kramer in this analysis or market report are solely Michael Kramer’s views. Readers should not treat any opinion, viewpoint, or prediction expressed by Michael Kramer as a specific solicitation or recommendation to buy or sell a particular security or follow a particular strategy. Michael Kramer’s analyses are based upon information and independent research that he considers reliable, but neither Michael Kramer nor Mott Capital Management guarantees its completeness or accuracy, and it should not be relied upon as such. Michael Kramer is not under any obligation to update or correct any information presented in his analyses. Mr. Kramer’s statements, guidance, and opinions are subject to change without notice. Past performance is not indicative of future results. Neither Michael Kramer nor Mott Capital Management guarantees any specific outcome or profit. You should be aware of the real risk of loss in following any strategy or investment commentary presented in this analysis. Strategies or investments discussed may fluctuate in price or value. Investments or strategies mentioned in this analysis may not be suitable for you. This material does not consider your particular investment objectives, financial situation, or needs and is not intended as a recommendation appropriate for you. You must make an independent decision regarding investments or strategies in this analysis. Upon request, the advisor will provide a list of all recommendations made during the past twelve months. Before acting on information in this analysis, you should consider whether it is suitable for your circumstances and strongly consider seeking advice from your own financial or investment adviser to determine the suitability of any investment.


