

By: Simona M Mocuta, Chief Economist, Amy Le, CFA Investment Strategist, and Venkata Vamsea Krishna Bhimavarapu, Economist
Recent inflation data has been on the stronger side of expectations but this does not mean the Fed should pause easing. The time to pause is in Q1 2025, in our view.
US: Data Fluctuates, Policy Should Not
Last month, we thought that the in-line August inflation print would lead the Fed to settle for a typical 25-basis point cut. Instead, it went for a larger 50-bp point reduction, mostly on account of a softening labor market. Such are the ironies of the data flow: since then, the labor market data has improved, and the September CPI came in a touch stronger than expected. Should this lead the Fed to pause in November? We do not believe so. There is little to be gained but confusion from any sort of stop and go approach to policymaking so we remain on board with cuts in both November and December. The January meeting would be an opportune moment to pause and then allow incoming data to dictate whether the pause should be extended to March (right now, we do not think so).
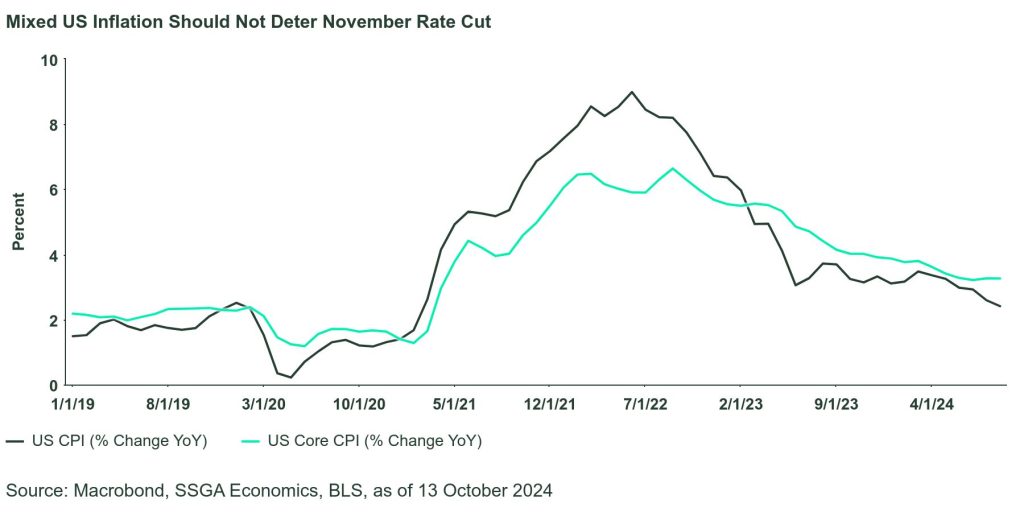
Overall prices rose 0.2% m/m in September, and core prices rose 0.3%. The headline was flattered by a 1.9% m/m decline in energy prices (gasoline was down 4.1% m/m) but food prices rose 0.4%. Services also increased 0.4%, but not because of housing, which only rose 0.2%. Indeed, shelter was up just 0.2% and owners’ equivalent rent 0.3%, the least in three months. However, we don’t want to read too much into this downshift as it has happened before and did not last. There seems to be some lingering seasonality as well, which suggest a higher print next month. And this month shelter was flattered by a big drop in hotel rates, that is unlikely to repeat (itself payback for big jump the month before).
Core goods prices increased 0.2% m/m, the most since May of 2023 on a combination of surging apparel prices and higher car prices. The broader trend of goods disinflation may be starting to abate and risks on this front are intensifying (threat of tariffs, strikes, weather, etc.). This is something to watch for in 2025 but we suspect we’ll slide towards, not fall into it. Services prices rose 0.4% m/m overall, lifted by a 1.4% m/m jump in transportation services (airfares posted another big increase) and a 0.7% jump in medical care services.
All this left headline CPI inflation at 2.4% y/y in September, a tenth lower than in August, but core inflation rose a tenth to 3.3% y/y. Headline inflation looks likely to tick up a little further though year-end, though core should stabilize here or even improve incrementally.
Canada: Labor Market Easing Continues
The Canadian labor market has remained relatively strong in light of surging immigration. Post-pandemic, temporary immigration added more than 1 million people to population. That led to a population growth of 3.2%, the highest rate since the late 1950s. Labor force also grew robustly, boosting near-term economic activity and lowering upward pressure on wages.
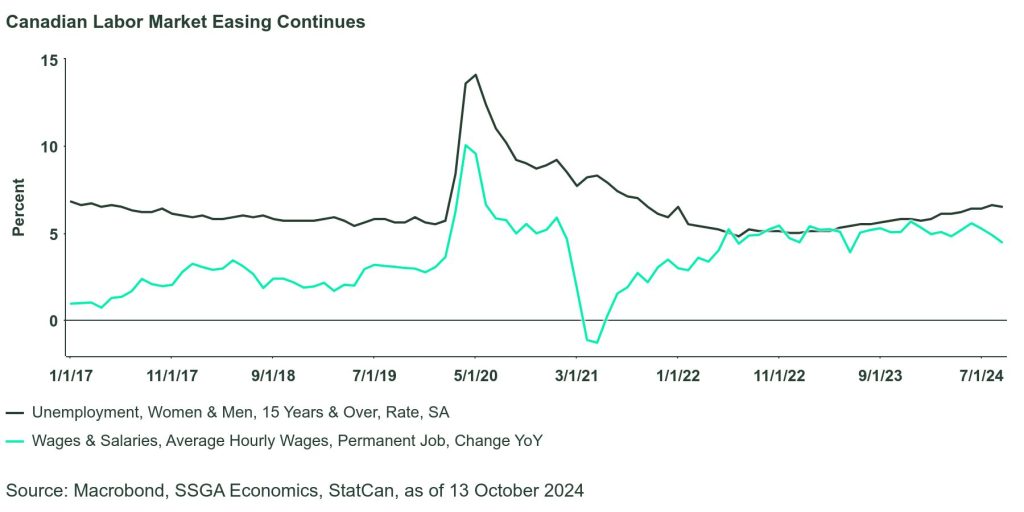
As the economy started feeling the impact of interest rate hikes, the labor market has cooled down considerably. The unemployment rate has increased from 5.7% in January to 6.6% in August. Importantly, during the past four months, the weakening trend has been supported by lower hiring demand and increasing unemployment, which is consistent with a slowdown in economic activity.
After four months of little change, the economy added 47k jobs in September, driven entirely by full-time jobs (+112k). Meanwhile, the unemployment rate edged down one tenth to 6.5%, but the decline was entirely driven by youth aged 15-24, implying that this retreat might just be temporary. The labor participation rate also fell two tenths to 64.9%.
The modest decline in the unemployment rate in September does not change our view that the labor market is weakening. We expect the unemployment rate should rise further in coming months, likely to close to 7.0% by the year end.
Wage growth was down to 4.5% y/y from 4.9% y/y previous month, remaining relatively strong and still well above productivity growth. We expect this downtrend in wages will continues as labor market eases further, lowering inflationary pressure.
UK: Low Growth Ahead of Autumn Budget
The latest monthly GDP data was released less than three weeks before the Autumn Budget and might have some implications on policy.
Prime Minister Sir Keir Starmer and the Chancellor Reeves have put growth at the heart of Labour’s agenda. But with public debt hitting 100% of GDP in August, the highest level since early 1960s, it is quite challenging for them to deliver target growth with a tight budget.
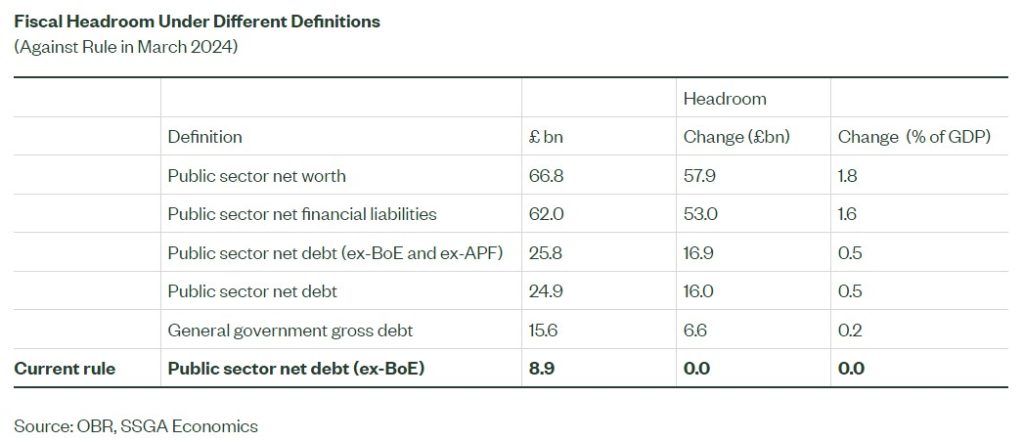
The Chancellor is considering a few ways to unlock some extra fiscal headroom and increase capital investment. Remember that the fiscal rules in place are that public sector net debt excluding the Bank of England (BoE) should be on course to fall as a share of GDP in five years’ time, and that public sector borrowing should not exceed 3% of GDP in five years’ time. As of March, those rules meant very modest headroom of just £8.9bn, just 0.3% of the GDP.
Without introducing major tax increases, the Chancellor is considering to shift to different debt targets, which will call for the government to balance the current budget over five years. That will of course boost the available headroom, but only to a certain extent as shown in Figure 3.
Labour might have also hoped that their upcoming budget will have some support from strong growth so far this year. However, the latest GDP figures were soft.
Following two quarters of robust expansion, the UK economy slowed markedly in Q3. Real GDP grew 0.2% m/m in August, after two months of stagnation. The modest increase was driven by broad-based increases in manufacturing, services and construction. Overall, Q3 growth is now estimated to be around 0.2%, which is lower than previous expectation of a 0.3% increase. It is also a marked slowdown from 0.7% and 0.5% in Q1 and Q2, respectively. It seems that the figure is far from perfect for the Labour if they were really looking for some additional headroom via stronger growth. Still, it’s worth noting that the key here is the projections from the Office for Budget Responsibility, which might already be too optimistic.
Meanwhile, monthly industrial production increased 0.5% in August 2024, bucking expectations of a smaller expansion of 0.2% and following an upwardly revised July. The increase was mainly supported by higher manufacturing (+1.1%). Production output for the three months to August 2024 remained flat compared with prior three months as gains in manufacturing, water supply and sewerage was offset by declines in mining and quarrying and electricity and gas.
Originally posted on Oct 14, 2024 on SSGA blog
PHOTO CREDIT: https://www.shutterstock.com/g/Dragon+Claws
VIA SHUTTERSTOCK
DISCLOSURES:
The information provided does not constitute investment advice and it should not be relied on as such. It should not be considered a solicitation to buy or an offer to sell a security. It does not take into account any investor’s particular investment objectives, strategies, tax status or investment horizon. You should consult your tax and financial advisor.
The information contained in this communication is not a research recommendation or ‘investment research’ and is classified as a ‘Marketing Communication’ in accordance with the applicable regional regulation. This means that this marketing communication (a) has not been prepared in accordance with legal requirements designed to promote the independence of investment research (b) is not subject to any prohibition on dealing ahead of the dissemination of investment research.
This communication is directed at professional clients (this includes eligible counterparties as defined by the “appropriate EU regulator”) who are deemed both knowledgeable and experienced in matters relating to investments. The products and services to which this communication relates are only available to such persons and persons of any other description (including retail clients) should not rely on this communication.
The views expressed in this material are the views of SSGA Economics Team through the period ended October 13, 2024 and are subject to change based on market and other conditions. This document contains certain statements that may be deemed forward-looking statements. Please note that any such statements are not guarantees of any future performance and actual results or developments may differ materially from those projected.
The whole or any part of this work may not be reproduced, copied or transmitted or any of its contents disclosed to third parties without SSGA’s express written consent.
All information is from SSGA unless otherwise noted and has been obtained from sources believed to be reliable, but its accuracy is not guaranteed. There is no representation or warranty as to the current accuracy, reliability or completeness of, nor liability for, decisions based on such information and it should not be relied on as such.


