By: Ryan Giannotto CFA, Equity Index Research Manager
The Fed’s rate cut has prompted a mixed response in equities. Explore how Russell 1000 and 2000 factors like Growth, Value, and Momentum reacted to this shift.
- Russell 1000 Growth outperformed by 57 bps while Value lagged by 62 bps after the Fed cut.
- Small caps in the Russell 2000 showed a greater response to the easing cycle.
- Momentum performed strongly across small and large caps, especially in the Russell 2000.
What does the new easing cycle recently unleashed by the Federal Reserve mean for the US equity market?
Rate cuts—and the factors which cause them— carry profound implications for portfolios, but the finer details this time around are not so easy to discern. In part this dilemma emerges because markets have not experienced a non-emergency induced cutting cycle in recent memory, and certainly not since the emergence of factor analysis.
How do we evaluate the capacity for intra-asset and Russell Style rotation? It is not a perfect assessment, but the absence of a valid performance history makes the snap reaction of the big five factors a noteworthy analysis. After the first complete day of price action following the Fed announcement, we here examine the active returns of the big five factors and Russell Style in both the Russell 1000 and Russell 2000 universes.
The Fed as a Factor
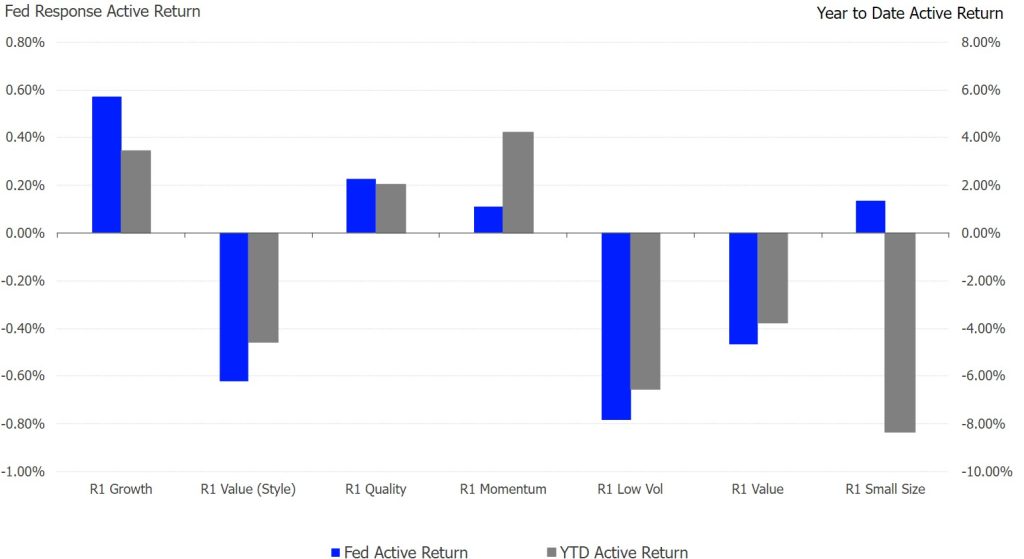
Beginning with large cap equities, most striking was the opposite yet nearly equal reaction of the Russell Style indices, with the Russell 1000 Growth Index outperforming by 57 basis points while Russell 1000 Value Index underperformed by 62 basis points. Given that the Russell 1000 appreciated 146 basis points over this performance interval, Growth as a style achieved 2.4 times the return of its value counterpart. Moving to the more precise factor definition of value, this formulation lagged the benchmark by 47 basis points, perhaps portending an out of phase cycle for this risk premium.
Large Cap Factor Returns
Please see the end for important legal disclosures.
It is low volatility, however, that constituted the most extreme and the most negative of any risk factor, trailing the benchmark Russell 1000 by 78 basis points. Indeed, this exposure washed out over half the gains attributable to raw equity market risk. This response was logical given that low volatility sees less movement than the market overall—as is almost definitional—and this factor is embedded with less duration as well.
Small Caps, High Sensitivities
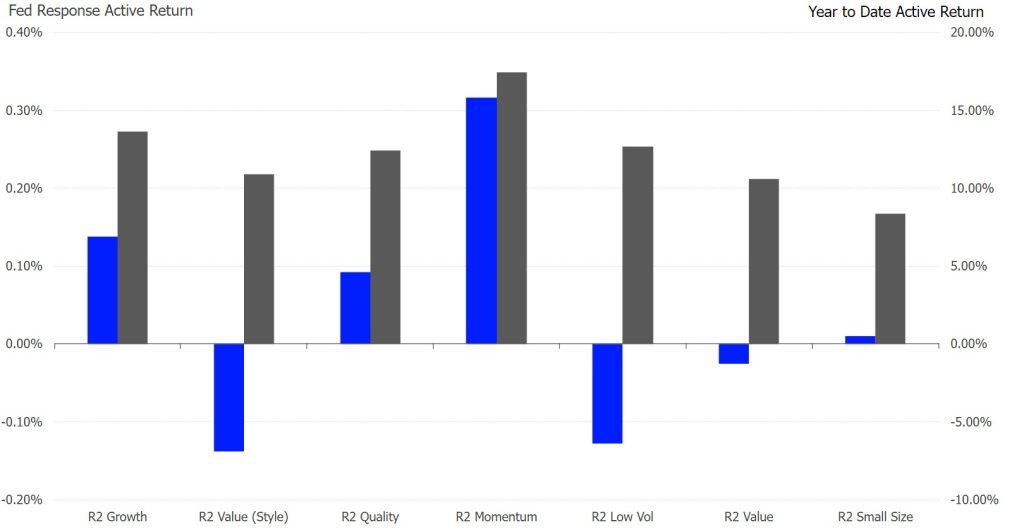
Compared to their large cap brethren, the small cap stocks in the Russell 2000 reacted with 47% greater magnitude to the 50-basis point cut, with the benchmark surging 2.14%. This enhanced movement is consistent with the heightened sensitivity of small caps to changes in monetary policy historically, and yet the impacts ripple through the factors distinctly.
Small Cap Factor Returns
Please see the end for important legal disclosures.
Foremost, the dispersion of active returns was far more constrained in comparison to the effects within the Russell 1000 universe, with the average deviation 70.9% lower. Hence, the unique risks attendant to very low market caps dominated the influence of the big five factors, at least when it comes to the monetary impulse.
Some similarities to the large cap ecosystem remained however, such as the symmetric split between Growth and Value style active returns (plus or minus 18 basis points). Likewise, Quality outperformed while Low Volatility underperformed, yet striking is the degree to which momentum outperformed in small caps. At nearly three-fold the scale of active return versus that seen in large caps, the 32-basis point surge in small cap Momentum highlighted the eccentricities of the Russell 2000 factor environment. Furthermore, that the factor Value underperformed by only three basis points shows how factor premia behave differently when the asset class is two orders of magnitude smaller in size.
Don’t Fight the Fed (Factor)?
The circumstances surrounding this initiating rate cut, and the lack of historical analogue for non-crisis easing, underscore the role of factors in explaining U.S. equity returns.
Monetary policy interacts uniquely with each of the five factors in large and small cap environments—and examining these immediate return differentials can help inform future expectations. Indeed, understanding these intricacies can be the difference between facilitating or fighting the Fed as a factor.
Originally posted on October 10, 2024 on LSEG blog
PHOTO CREDIT: https://www.shutterstock.com/g/AddMeshCube
VIA SHUTTERSTOCK
DISCLOSURES:
All information is provided for information purposes only. All information and data contained in this publication is obtained by LSEG, from sources believed by it to be accurate and reliable. Because of the possibility of human and mechanical inaccuracy as well as other factors, however, such information and data is provided “as is” without warranty of any kind. No member of LSEG nor their respective directors, officers, employees, partners or licensors make any claim, prediction, warranty or representation whatsoever, expressly or impliedly, either as to the accuracy, timeliness, completeness, merchantability of any information or LSEG Products, or of results to be obtained from the use of LSEG products, including but not limited to indices, rates, data and analytics, or the fitness or suitability of the LSEG products for any particular purpose to which they might be put. The user of the information assumes the entire risk of any use it may make or permit to be made of the information.
Past performance is no guarantee of future results. Charts and graphs are provided for illustrative purposes only. Index and/or rate returns shown may not represent the results of the actual trading of investable assets. Certain returns shown may reflect back-tested performance. All performance presented prior to the index or rate inception date is back-tested performance. Back-tested performance is not actual performance, but is hypothetical. The back-test calculations are based on the same methodology that was in effect when the index or rate was officially launched. However, back-tested data may reflect the application of the index or rate methodology with the benefit of hindsight, and the historic calculations of an index or rate may change from month to month based on revisions to the underlying economic data used in the calculation of the index or rate.
This document may contain forward-looking assessments. These are based upon a number of assumptions concerning future conditions that ultimately may prove to be inaccurate. Such forward-looking assessments are subject to risks and uncertainties and may be affected by various factors that may cause actual results to differ materially. No member of LSEG nor their licensors assume any duty to and do not undertake to update forward-looking assessments.
No part of this information may be reproduced, stored in a retrieval system or transmitted in any form or by any means, electronic, mechanical, photocopying, recording or otherwise, without prior written permission of the applicable member of LSEG. Use and distribution of LSEG data requires a licence from LSEG and/or its licensors.
Read in detail here.