By: Kevin Flanagan, Head of Fixed Income Strategy
Key Takeaways
- The recent U.S. Treasury yield rally is compared to a similar rally in Q4 2023, driven by expectations of a shift in Federal Reserve policy.
- Significant yield movements in UST 2-Year and 10-Year notes over the past two months are highlighted, where the UST 2- and 10-Year trading ranges have been moved lower.
- The need for validation of the recent rally is emphasized, questioning whether the UST 2-Year yield being significantly below the Fed Funds Rate is justified given current economic data.
Is this going to be another case of “déjà vu all over again”? Obviously, I’m referring to another incredible rally in the U.S. Treasury (UST) market, much like investors saw in Q4 of last year. As was the case then, it is still the case now: the Treasury rally needs to be validated.
Let’s take a step back to that Q4 plunge in UST yields. The catalyst for that move was the notion of a pivot in Fed policy from rate hikes to rate cuts brought about by improving inflation data and potential softening in economic reports. In hindsight, we all know how that turned out: i.e., the rally was not validated, and as a result, UST yields reversed course in a visible fashion, reaching their 2024 peaks in late April.
U.S. Treasury Yields
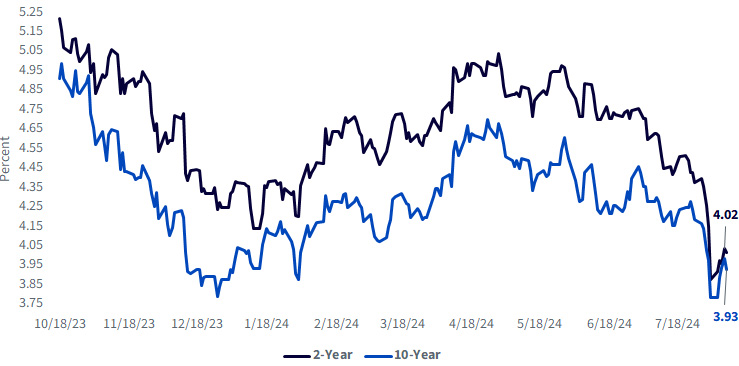
Source: Bloomberg, as of 8/9/24.
Fast-forward to the present, where the decline in UST yields was eerily similar to the Q4 experience. For this blog post, I’m going to concentrate on the UST 2- and 10-Year yields. As I mentioned, technically, the 2024 peak readings for each of these maturities actually occurred in late April, but I wanted to highlight the yield movements that have transpired just a little over the last two months.
Taking the 2-Year first, from its late May level, the yield dropped at one point by an incredible 132 basis points (bps), bringing the reading to an intraday low of 3.65%. Of course, most of the headlines are reserved for the UST 10-Year note. In this case, the yield plunged 94 bps for an intraday posting of 3.67%. For the record, in Q4, the declines in yield for the 2- and 10-Year notes were 110 bps and 120 bps, respectively.
Interestingly, while the starting points in terms of yield levels for this most recent rally were a bit lower than the Q4 episode, the aforementioned low watermarks were visibly below those readings, especially for the UST 2-Year note. Indeed, the UST 2-Year nadir was nearly 50 bps less than the prior low point. Why is that noteworthy? Go back to my prior blog post where I discussed Treasury correlations to the Fed Funds target range, and as you may recall, the UST 2-Year yield is very positively correlated to overnight money. Thus, at its low point, the 2-Year was discounting a very aggressive rate-cutting policy from the Fed, considering the midpoint Fed Funds Rate is still at 5.375%.
This is where validation comes back into play. Did it make sense for the UST 2-Year yield to be an eye-opening 173 bps below the Fed Funds level? Given price action as last week progressed, the market’s answer was definitely in the negative, as the yield moved back above the 4% threshold. Yes, disinflation appears to still be intact, but the economic data does not—at this point anyway—point to an imminent recession/hard landing. In fact, the ISM Services gauge that was released last week came in better than expected and above the “50” line of demarcation between expansion and contraction. Perhaps more importantly, weekly jobless claims fell more than projected, completely reversing the prior week’s increase, which had helped to give rise to all those labor market concerns. There was similar yield movement for the UST 10-Year as well, as the rate here bounced 30 bps off its low watermark.
Conclusion
Market expectations now definitely expect a rate cut from the Fed in September, but upcoming labor market data will more than likely hold the key as to whether it will be a 25bp or 50bp easing move. While the UST 2 and 10-year trading ranges have moved lower, if the data don’t point the Fed in the UST market’s direction, this most recent rally could once again not be completely validated.
Originally Posted August 14th, 2024, WisdomTree
PHOTO CREDIT: https://www.shutterstock.com/g/bpperry
Via SHUTTERSTOCK
U.S. investors only: Click here to obtain a WisdomTree ETF prospectus which contains investment objectives, risks, charges, expenses, and other information; read and consider carefully before investing.
There are risks involved with investing, including possible loss of principal. Foreign investing involves currency, political and economic risk. Funds focusing on a single country, sector and/or funds that emphasize investments in smaller companies may experience greater price volatility. Investments in emerging markets, currency, fixed income and alternative investments include additional risks. Please see prospectus for discussion of risks.
Past performance is not indicative of future results. This material contains the opinions of the author, which are subject to change, and should not to be considered or interpreted as a recommendation to participate in any particular trading strategy, or deemed to be an offer or sale of any investment product and it should not be relied on as such. There is no guarantee that any strategies discussed will work under all market conditions. This material represents an assessment of the market environment at a specific time and is not intended to be a forecast of future events or a guarantee of future results. This material should not be relied upon as research or investment advice regarding any security in particular. The user of this information assumes the entire risk of any use made of the information provided herein. Neither WisdomTree nor its affiliates, nor Foreside Fund Services, LLC, or its affiliates provide tax or legal advice. Investors seeking tax or legal advice should consult their tax or legal advisor. Unless expressly stated otherwise the opinions, interpretations or findings expressed herein do not necessarily represent the views of WisdomTree or any of its affiliates.
The MSCI information may only be used for your internal use, may not be reproduced or re-disseminated in any form and may not be used as a basis for or component of any financial instruments or products or indexes. None of the MSCI information is intended to constitute investment advice or a recommendation to make (or refrain from making) any kind of investment decision and may not be relied on as such. Historical data and analysis should not be taken as an indication or guarantee of any future performance analysis, forecast or prediction. The MSCI information is provided on an “as is” basis and the user of this information assumes the entire risk of any use made of this information. MSCI, each of its affiliates and each entity involved in compiling, computing or creating any MSCI information (collectively, the “MSCI Parties”) expressly disclaims all warranties. With respect to this information, in no event shall any MSCI Party have any liability for any direct, indirect, special, incidental, punitive, consequential (including loss profits) or any other damages (www.msci.com)
Jonathan Steinberg, Jeremy Schwartz, Rick Harper, Christopher Gannatti, Bradley Krom, Kevin Flanagan, Brendan Loftus, Joseph Tenaglia, Jeff Weniger, Matt Wagner, Alejandro Saltiel, Ryan Krystopowicz, Brian Manby, and Scott Welch are registered representatives of Foreside Fund Services, LLC.
WisdomTree Funds are distributed by Foreside Fund Services, LLC, in the U.S. only.
You cannot invest directly in an index.