By: Maxwell Gold, CFA, Head of Gold Strategy
Gold Market Recap & Outlook
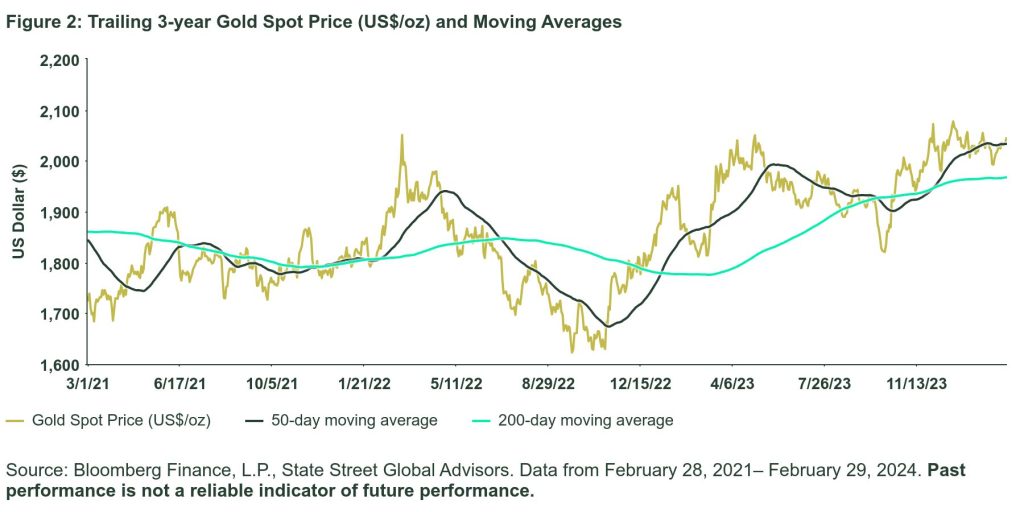
February saw the gold spot price rise 0.23%, closing the month at US$2,044/oz.1 The spot price ranged from a low of US$1,984/oz to a high of US$2,065/oz; after a brief mid-month dip below $2,000/oz, it found support back above the key psychological price level.2 Gold’s recent price resilience has been supported by strength across global fundamental demand sectors.
Global gold demand for 2023 remained robust, driven by significant central bank buying and strong jewelry demand. Central bank gold purchases exceeded 1,000 metric tons (~US$63B) for the second consecutive year.3 China, Poland, and Singapore were the largest buyers with net purchases also from Libya, Czech Republic, India, and Iraq.4 Overall, jewelry demand remains well supported above pandemic-era lows, with jewelry fabrication demand holding steady against an environment of higher gold prices for consumers. Retail bar and coin investment demand only saw a mild contraction in 2023 despite higher gold prices as a decline in European demand was balanced by strength in China.5
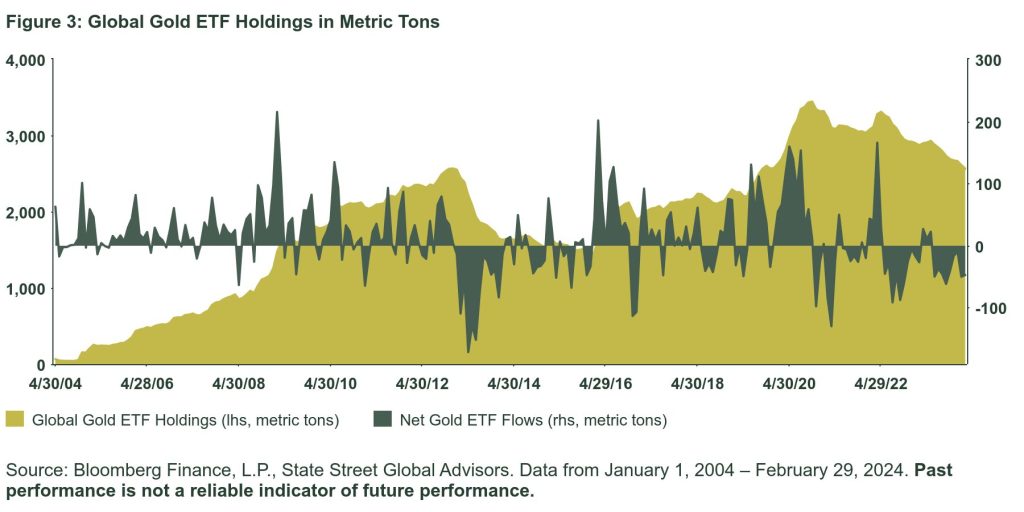
The missing piece of the gold puzzle remains institutional investor demand, as measured by global gold exchange traded funds (ETFs). 2023 marked the third consecutive year of net outflows from gold ETFs despite the spot price rising 13.1% last year, with net outflows persisting thus far in 2024.6 Since gold last bottomed at US$1,622/oz on September 26, 2022, it has risen over 30% and is within striking distance of setting a new record high this year.7 During this same period, gold ETF holdings decreased by over 20%.8 Evaluating this recent disconnect between global gold ETF flows and the gold price (to which these funds directly track) begs the question: are investors missing out on the start of the next gold bull market?
Many investors appear to be waiting for a clear signal from the Federal Reserve (Fed) as to the start of interest rate cuts before jumping back into the gold market. The disconnect between ETF flows and gold price, likely fueled by strong demand in other sectors like central banks, may return to synchronization as the Fed begins cutting rates — reducing gold’s relative opportunity cost. Such a timing strategy may prove challenging to predict. Instead, given the unprecedented disconnect, investors may benefit from getting ahead of the curve and shoring up portfolio allocations to gold before anticipated interest rate cuts or a resurgence in market volatility, currently trending near four-year lows, come to fruition.9
Gold’s Chart of the Month

Gold Performance Drivers
Flows
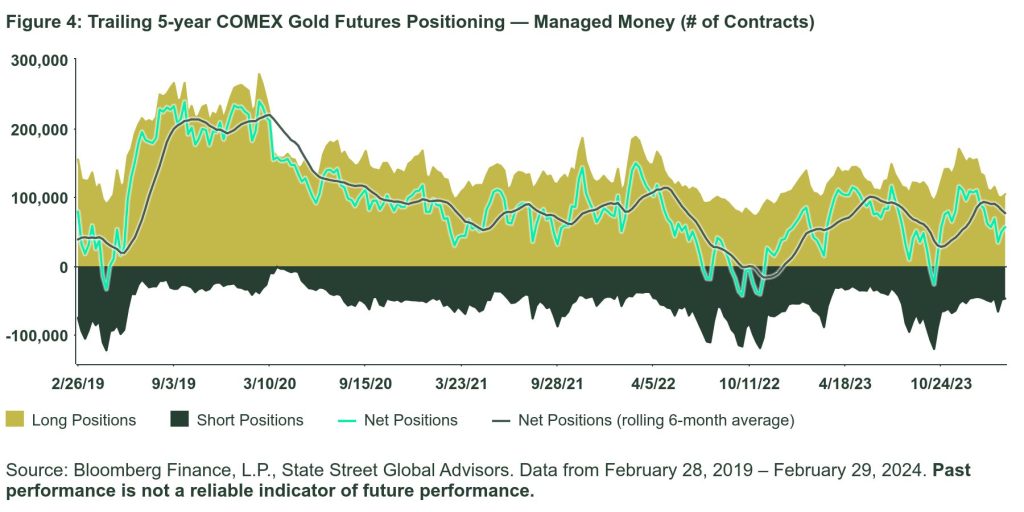
Global gold-backed ETFs registered outflows in February, the ninth consecutive month, as gold ETF holdings fell by 1.8%.10 COMEX managed money net speculative gold positions remained bullish and broadly unchanged from last month at 56,153 contracts.11
Factors
The US Consumer Price Index (CPI) fell to 3.1% year over year as of January 2024, down from 3.4% the month prior.12 US 10-year Treasury yields closed February at 4.25%, up from 3.91% at the end of January.13
Fundamentals
China’s gold consumption during the longer-than-usual 2024 Chinese New Year was robust, despite Chinese consumers spending a record amount on domestic travel, according to the World Gold Council. Gold retailers saw a constant flow of customers during the holiday with data from the Ministry of Commerce showing gold and jewelry sales in China rising 24% year over year during the holiday.14
Gold Price Trends
Gold ETF Flows
Gold Futures
Originally Posted March 7th, 2024, on State Street Global Advisors’ blog
PHOTO CREDIT:https://www.shutterstock.com/g/macrowildlife
Via SHUTTERSTOCK
Footnotes
1 Bloomberg Finance L.P., State Street Global Advisors. Data as of February 29, 2024.
2 Bloomberg Finance L.P., State Street Global Advisors. Data as of February 29, 2024.
3 World Gold Council, State Street Global Advisors. Data as of December 31, 2023.
4 World Gold Council, State Street Global Advisors. Data as of December 31, 2023.
5 World Gold Council, State Street Global Advisors. Data as of December 31, 2023.
6 Bloomberg Finance L.P., State Street Global Advisors. Data as of February 29, 2024.
7 Bloomberg Finance L.P., State Street Global Advisors. Data as of February 29, 2024.
8 Bloomberg Finance L.P., State Street Global Advisors. Data as of February 29, 2024.
9 Bloomberg Finance L.P., State Street Global Advisors. Data as of February 29, 2024. Market volatility as measured by the CBOE Volatility Index (VIX).
10 Bloomberg Finance L.P., State Street Global Advisors. Data as of February 29, 2024.
11 Bloomberg Finance L.P., State Street Global Advisors. Data as of February 27, 2024.
12 Bloomberg Finance L.P., State Street Global Advisors. Data as of February 29, 2024.
13 Bloomberg Finance L.P., State Street Global Advisors. Data as of February 29, 2024.
14 World Gold Council, State Street Global Advisors. Data as of December 31, 2023.
Disclosures
Important Risk Information
This communication is not intended to be an investment recommendation or investment advice and should not be relied upon as such.
The views expressed in this material are the views of the SPDR Gold Strategy Team through the period ended February 29, 2024 and are subject to change based on market and other conditions. This document contains certain statements that may be deemed forward looking statements. Please note that any such statements are not guarantees of any future performance and actual results or developments may differ materially from those projected.
The information provided does not constitute investment advice and it should not be relied on as such. It should not be considered a solicitation to buy or an offer to sell a security. It does not take into account any investor’s particular investment objectives, strategies, tax status or investment horizon. You should consult your tax and financial advisor.
The trademarks and service marks referenced herein are the property of their respective owners. Third party data providers make no warranties or representations of any kind relating to the accuracy, completeness or timeliness of the data and have no liability for damages of any kind relating to the use of such data.
The whole or any part of this work may not be reproduced, copied or transmitted or any of its contents disclosed to third parties without SSGA’s express written consent.
Commodities and commodity-index linked securities may be affected by changes in overall market movements, changes in interest rates, and other factors such as weather, disease, embargoes, or political and regulatory developments, as well as trading activity of speculators and arbitrageurs in the underlying commodities.
Investing in commodities entails significant risk and is not appropriate for all investors.
Diversification does not ensure a profit or guarantee against loss.
Past performance is not a reliable indicator of future performance.